Gold is trading around $3,338, positioned at a decisive point where both bullish momentum and bearish pressure are converging. The price action over the past few weeks suggests a brewing breakout, supported by multiple technical factors. This analysis provides a complete breakdown of what’s happening and what to anticipate next based on the current structure.
🔹 Market Structure & Context
Since mid-May, XAU/USD has been trading within a rising price channel, respecting a well-defined ascending trendline support. This rising support zone has provided a floor for buyers to step in, especially during pullbacks, which demonstrates consistent buying interest and underlying bullish sentiment.
At the same time, gold has also been respecting a descending trendline resistance formed by multiple lower highs. This forms a squeeze pattern, suggesting that the market is building energy for a breakout. As price compresses within this wedge-like structure, the tension between bulls and bears grows, setting the stage for a sharp directional move.
This is a classic accumulation vs. compression scenario, where the outcome of the breakout will dictate short-to-medium-term direction.
🔹 Channel Support Zone – Buyer’s Stronghold
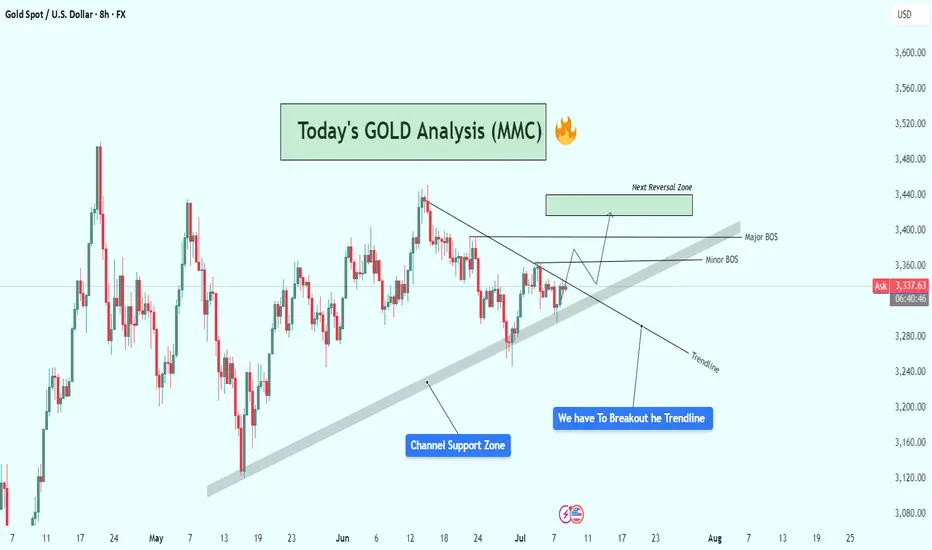
The channel support zone is critical here. This area, visible as a bold upward sloping line, has provided reliable support through repeated market cycles. It acts as a dynamic line where institutions and swing traders accumulate long positions during dips. The fact that price has respected this trendline for over a month signals the importance of this structure in current market psychology.
Any break below this zone would invalidate the bullish bias and open the door for a steeper decline. However, as long as price stays above this line, the buyers retain control.
🔹 Trendline Resistance – Key Barrier to Break
The descending trendline resistance, drawn from mid-June highs, has been a significant cap on upward moves. Each test of this trendline has resulted in a rejection, pushing price back into the range. Now, gold is testing this level again — and this time, the setup is stronger for a potential breakout due to growing momentum and multiple rejections weakening the resistance.
From a technical standpoint, the more a resistance level is tested, the weaker it becomes, and the higher the probability of a breakout.
🔹 Break of Structure (BOS) Zones – Momentum Confirmation
The chart marks both Minor BOS and Major BOS zones. These are crucial areas to watch for price confirmation.
The Minor BOS, just above the current price (around $3,360), represents a short-term structural shift. A clean break above this with strong candles and volume could trigger a momentum rally.
The Major BOS, located in the $3,400–$3,420 area, is more significant. This is the last major swing high. If gold manages to break and hold above this zone, it would confirm a complete bullish reversal in market structure — turning what was once a lower-high pattern into a potential new uptrend.
These BOS levels act as validation checkpoints for trend direction. Without a clean break, the move is unconfirmed and prone to reversal.
🔹 Next Reversal Zone – Anticipated Reaction Area
Above the BOS zones lies the Next Reversal Zone, marked in green. This is a potential area of resistance or profit-taking, based on historical price reactions, Fibonacci confluence, and psychological levels. This area spans approximately $3,420 to $3,440, which is where price might pause, consolidate, or reverse depending on momentum.
This zone doesn’t necessarily mean price will reverse immediately, but it’s a smart area for traders to monitor reactions or start managing their risk.
🔹 Price Action Flow – What Could Happen Next?
Currently, gold is testing both the trendline and the minor BOS, building momentum around this critical zone. There are two primary paths forward:
If gold breaks the descending trendline and confirms above the minor BOS:
Expect a move toward the major BOS at $3,400.
A successful break of this zone opens the path to the next reversal zone ($3,420–$3,440).
Bulls gain clear control and the market may attempt a sustained breakout continuation.
If gold gets rejected again at the trendline:
Price could drop back toward the channel support, between $3,280 and $3,250.
This would maintain the current consolidation range, with further testing likely before a breakout.
Bears may gain temporary control, but only a break below the ascending channel would signal a trend shift to the downside.
🔹 Why This Setup Matters
This chart captures a textbook breakout setup — compression at a trendline, rising channel support, and BOS zones layered in. These kinds of technical setups often precede strong moves because:
Volume typically increases after breakout zones are breached.
Market participants are watching the same structure, making reactions more predictable.
Risk-to-reward becomes favorable with tight invalidation points.
For disciplined traders, this is a high-probability environment to wait for confirmation and trade the reaction, not the anticipation.
🔹 Risk Management Reminder
It’s essential not to chase breakouts prematurely. Look for:
Strong bullish candles breaking key resistance.
Retests of broken trendlines turning into support.
Volume confirmation (spikes can signal genuine breakout vs. fakeout).
Also, be prepared for false breakouts, especially during overlapping macroeconomic events or low liquidity sessions.
🧭 Final Thoughts
This is a powerful confluence zone for gold, and whichever side breaks it will likely control the next leg. Whether you're a day trader or a swing trader, this is a must-watch area on your chart.
Stay alert, trade with confirmation, and respect your risk parameters.
🔹 Market Structure & Context
Since mid-May, XAU/USD has been trading within a rising price channel, respecting a well-defined ascending trendline support. This rising support zone has provided a floor for buyers to step in, especially during pullbacks, which demonstrates consistent buying interest and underlying bullish sentiment.
At the same time, gold has also been respecting a descending trendline resistance formed by multiple lower highs. This forms a squeeze pattern, suggesting that the market is building energy for a breakout. As price compresses within this wedge-like structure, the tension between bulls and bears grows, setting the stage for a sharp directional move.
This is a classic accumulation vs. compression scenario, where the outcome of the breakout will dictate short-to-medium-term direction.
🔹 Channel Support Zone – Buyer’s Stronghold
The channel support zone is critical here. This area, visible as a bold upward sloping line, has provided reliable support through repeated market cycles. It acts as a dynamic line where institutions and swing traders accumulate long positions during dips. The fact that price has respected this trendline for over a month signals the importance of this structure in current market psychology.
Any break below this zone would invalidate the bullish bias and open the door for a steeper decline. However, as long as price stays above this line, the buyers retain control.
🔹 Trendline Resistance – Key Barrier to Break
The descending trendline resistance, drawn from mid-June highs, has been a significant cap on upward moves. Each test of this trendline has resulted in a rejection, pushing price back into the range. Now, gold is testing this level again — and this time, the setup is stronger for a potential breakout due to growing momentum and multiple rejections weakening the resistance.
From a technical standpoint, the more a resistance level is tested, the weaker it becomes, and the higher the probability of a breakout.
🔹 Break of Structure (BOS) Zones – Momentum Confirmation
The chart marks both Minor BOS and Major BOS zones. These are crucial areas to watch for price confirmation.
The Minor BOS, just above the current price (around $3,360), represents a short-term structural shift. A clean break above this with strong candles and volume could trigger a momentum rally.
The Major BOS, located in the $3,400–$3,420 area, is more significant. This is the last major swing high. If gold manages to break and hold above this zone, it would confirm a complete bullish reversal in market structure — turning what was once a lower-high pattern into a potential new uptrend.
These BOS levels act as validation checkpoints for trend direction. Without a clean break, the move is unconfirmed and prone to reversal.
🔹 Next Reversal Zone – Anticipated Reaction Area
Above the BOS zones lies the Next Reversal Zone, marked in green. This is a potential area of resistance or profit-taking, based on historical price reactions, Fibonacci confluence, and psychological levels. This area spans approximately $3,420 to $3,440, which is where price might pause, consolidate, or reverse depending on momentum.
This zone doesn’t necessarily mean price will reverse immediately, but it’s a smart area for traders to monitor reactions or start managing their risk.
🔹 Price Action Flow – What Could Happen Next?
Currently, gold is testing both the trendline and the minor BOS, building momentum around this critical zone. There are two primary paths forward:
If gold breaks the descending trendline and confirms above the minor BOS:
Expect a move toward the major BOS at $3,400.
A successful break of this zone opens the path to the next reversal zone ($3,420–$3,440).
Bulls gain clear control and the market may attempt a sustained breakout continuation.
If gold gets rejected again at the trendline:
Price could drop back toward the channel support, between $3,280 and $3,250.
This would maintain the current consolidation range, with further testing likely before a breakout.
Bears may gain temporary control, but only a break below the ascending channel would signal a trend shift to the downside.
🔹 Why This Setup Matters
This chart captures a textbook breakout setup — compression at a trendline, rising channel support, and BOS zones layered in. These kinds of technical setups often precede strong moves because:
Volume typically increases after breakout zones are breached.
Market participants are watching the same structure, making reactions more predictable.
Risk-to-reward becomes favorable with tight invalidation points.
For disciplined traders, this is a high-probability environment to wait for confirmation and trade the reaction, not the anticipation.
🔹 Risk Management Reminder
It’s essential not to chase breakouts prematurely. Look for:
Strong bullish candles breaking key resistance.
Retests of broken trendlines turning into support.
Volume confirmation (spikes can signal genuine breakout vs. fakeout).
Also, be prepared for false breakouts, especially during overlapping macroeconomic events or low liquidity sessions.
🧭 Final Thoughts
This is a powerful confluence zone for gold, and whichever side breaks it will likely control the next leg. Whether you're a day trader or a swing trader, this is a must-watch area on your chart.
Stay alert, trade with confirmation, and respect your risk parameters.
For Daily Trade Setups and Forecast: 📈 t.me/xauusdoptimizer
Premium Signals Fr33: 💯 t.me/xauusdoptimizer
🥰🥳🤩
Premium Signals Fr33: 💯 t.me/xauusdoptimizer
🥰🥳🤩
Related publications
Disclaimer
The information and publications are not meant to be, and do not constitute, financial, investment, trading, or other types of advice or recommendations supplied or endorsed by TradingView. Read more in the Terms of Use.