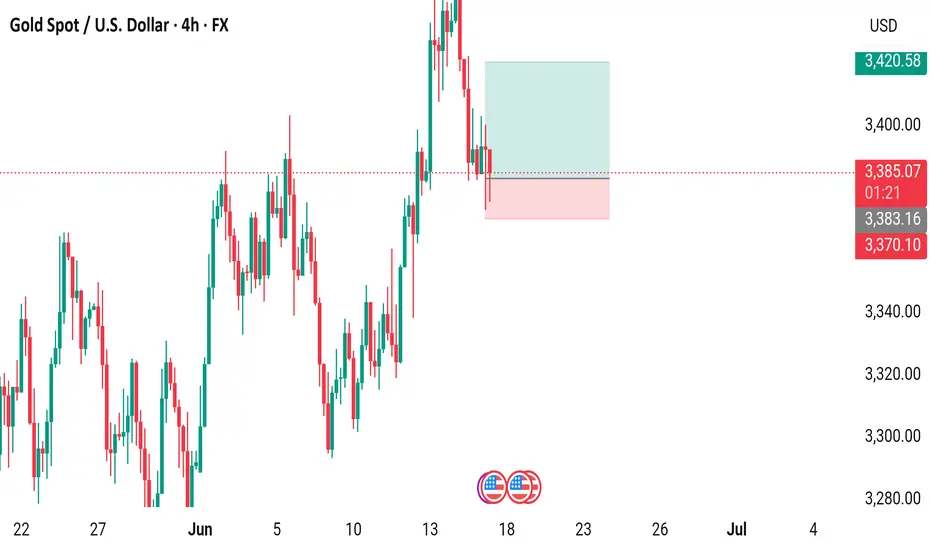
4-hour candlestick chart displays the price movement of Gold Spot (XAU) against the U.S. Dollar (USD) from late June to mid-July 2025. The current price is $3,385.30, with a slight increase of $0.66 (+0.02%). The chart highlights a recent upward trend, with a resistance level around $3,420.58 and a support level near $3,370.10, as indicated by the shaded zones.
Daily XAU/USD FREE setups | Let's grow together!
| XAU/USD Trader | Telegram: https://t.me/Aleegoldsignals
| XAU/USD Trader | Telegram: https://t.me/Aleegoldsignals
Disclaimer
The information and publications are not meant to be, and do not constitute, financial, investment, trading, or other types of advice or recommendations supplied or endorsed by TradingView. Read more in the Terms of Use.