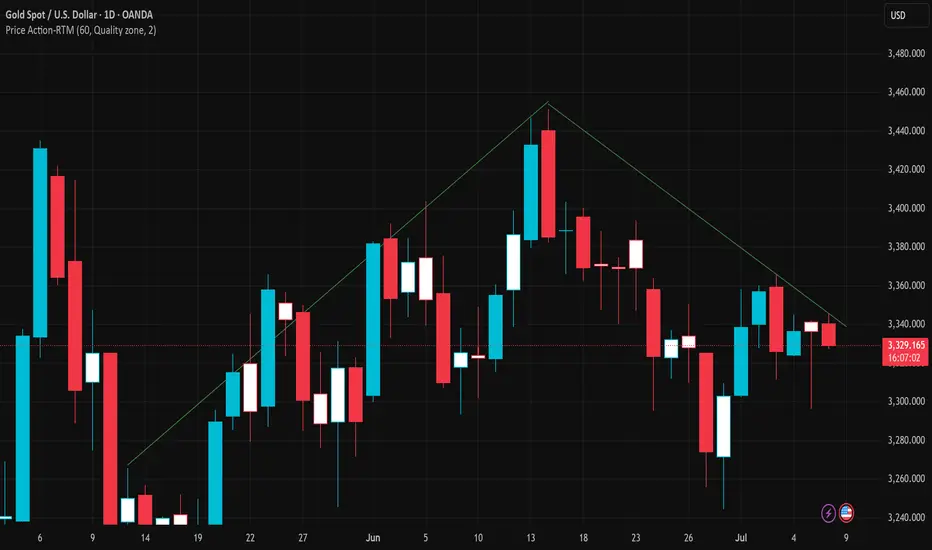
Gold is currently trading around 3,328 USD after failing to break above the descending trendline that started from the mid-June peak. On the chart, the price forms a series of lower highs and lower lows — a classic signal of a medium-term downtrend.

The descending trendline (green) acts as dynamic resistance. Each time price approaches it, strong selling pressure pushes it back down, showing sellers are in control.
In the short term, the 3,300 – 3,310 USD area serves as immediate support. If this zone is broken, price could drop further toward the major support zone around 3,260 – 3,270 USD.
Conversely, a confirmed reversal would only be valid if price breaks above the descending trendline and closes sustainably above 3,371 USD — a historically significant distribution zone.
The most recent daily candle is a small-bodied red candle with a long lower wick, indicating weak buying pressure and market indecision — typical in a consolidation phase before further downside.
Strategy Summary:
Favor short positions on pullbacks to the descending trendline.
Avoid bottom-fishing until a confirmed breakout above major resistance.
Traders should monitor the 3,300 USD zone closely in upcoming sessions.
Note: The analysis above is for informational purposes only and does not constitute investment advice. Stay tuned for further updates and adjust your trading plan accordingly.
What’s your take on the next move for gold? Share your thoughts in the comments!
🪙 JOIN OUR FREE TELEGRAM GROUP 🪙
t.me/dnaprofits
Join the community group to get support and share knowledge!
️🥇 Exchange and learn market knowledge
️🥇 Support free trading signals
t.me/dnaprofits
Join the community group to get support and share knowledge!
️🥇 Exchange and learn market knowledge
️🥇 Support free trading signals
Related publications
Disclaimer
The information and publications are not meant to be, and do not constitute, financial, investment, trading, or other types of advice or recommendations supplied or endorsed by TradingView. Read more in the Terms of Use.