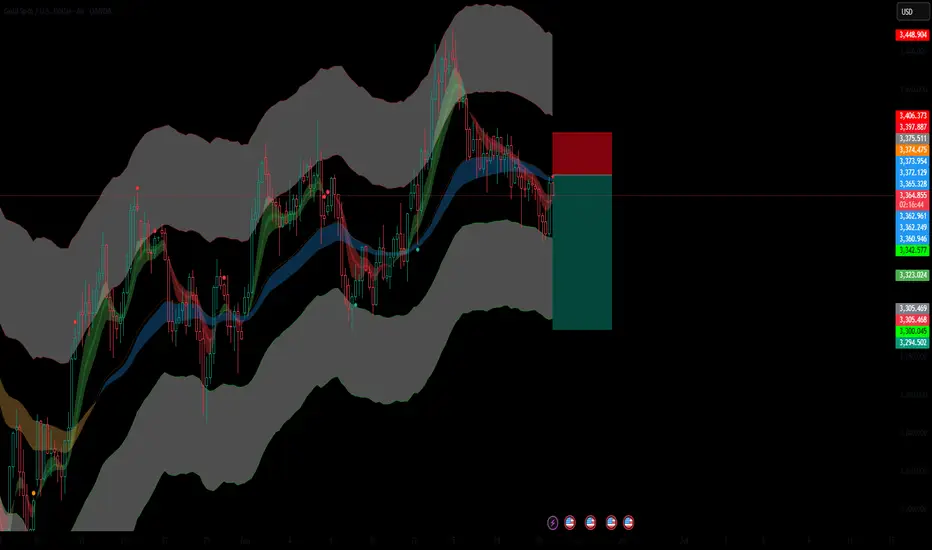
Gold is showing signs of potential downside pressure on the 4-hour chart. After a rejection from the upper volatility band and a failure to sustain bullish momentum above the dynamic EMA cloud, price has rolled over and is now trading below the midline support area.
🔻 Bearish Structure Developing:
Price rejected strongly from the upper gray zone (Resistance band).
A new lower high has formed, aligning with bearish market structure.
Candles are trading under the red-to-blue transition EMA ribbon, indicating increasing bearish sentiment.
🎯 Trade Setup:
Entry: Near 3,365
SL: Above the recent high near 3,406
TP: Targeting the lower band support around 3,300 – 3,323
Trade active
Trade closed: target reached
Related publications
Disclaimer
The information and publications are not meant to be, and do not constitute, financial, investment, trading, or other types of advice or recommendations supplied or endorsed by TradingView. Read more in the Terms of Use.
Related publications
Disclaimer
The information and publications are not meant to be, and do not constitute, financial, investment, trading, or other types of advice or recommendations supplied or endorsed by TradingView. Read more in the Terms of Use.