📘 EDUCATIONAL POST: Can Gold Really Drop 10% in a Day? Let’s Break It Down
Alright, traders—before you start thinking the sky is falling, let’s look this chart straight in the face and get real.
⸻
🔍 The Setup Right Now
Here’s what’s showing up:
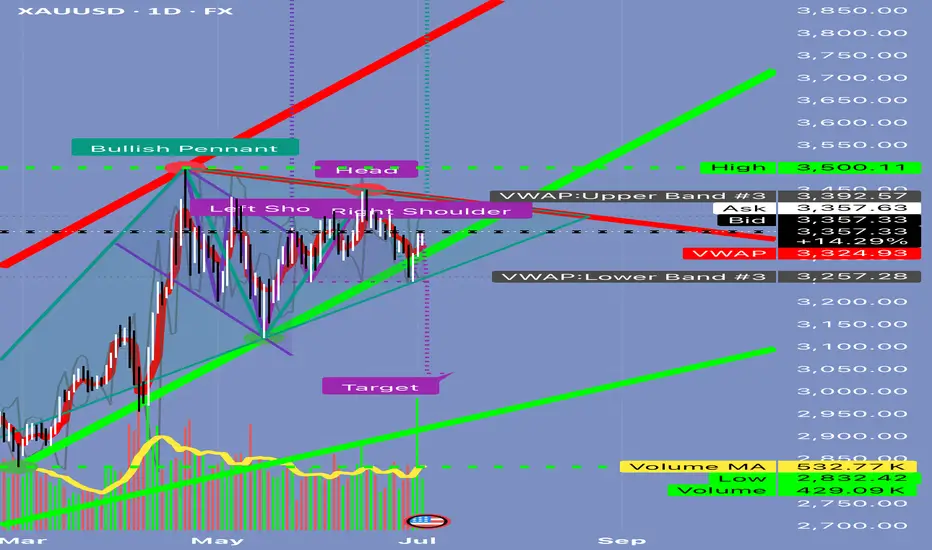
✅ A bullish pennant forming up top (potential continuation higher).
✅ A big head and shoulders pattern in the middle (bearish).
✅ VWAP bands ranging from ~3,257 to ~3,392.
✅ Volume is underwhelming—426k vs 582k average.
✅ A big target line all the way down near 3,000.
This mix of signals can be confusing. Let’s separate the hype from what’s actually possible.
⸻
🎯 Q: Can the market collapse to 3,000 tomorrow?
Short Answer:
No.
Here’s Why:
1️⃣ Move Size:
• Current price is ~3,357.
• Target is ~3,000.
• That’s a -357 point drop (~10.6%) in one session.
• For gold CFDs, this would be an extreme event only seen in major crises (think 2008 or March 2020).
2️⃣ Volume Context:
• Today’s volume is below average.
• Big crashes are usually preceded by heavy distribution—this isn’t showing yet.
3️⃣ VWAP Anchors:
• The lower VWAP band sits at 3,257.
• Reaching 3,000 would require breaking through 3,257 support, 3,100, and months of prior buying interest.
4️⃣ Market Environment:
• It’s the July 4th holiday in the U.S.—liquidity is thin.
• Thin markets can gap lower but rarely hold a massive drop without a big catalyst (e.g., credit crisis, war headlines).
5️⃣ Pattern Confirmation:
• Yes, the head and shoulders pattern is visible.
• But to confirm it, you need:
🔹 A clear break of the neckline with double average volume.
🔹 Follow-through that pushes below 3,257.
• None of this has happened yet.
⸻
✅ What’s Realistically Possible Tomorrow?
If sellers show up, here’s what a big bearish day might look like:
1️⃣ First Move:
• Rejection at 3,357–3,392 resistance.
• Pullback toward ~3,324 (mid VWAP).
2️⃣ Continuation:
• Drop down to ~3,257 (VWAP lower band).
3️⃣ Extreme Scenario:
• Retest of 3,200–3,150 zone.
But a flush all the way to 3,000?
👉 Highly unlikely unless there’s a major global shock.
⸻
💡 Trading Tip: Stay Tactical
If you want to position short:
✅ Wait for rejection at 3,357–3,392.
✅ Short targeting 3,324 first.
✅ Scale profits there.
✅ Only hold runners for 3,200–3,150 if momentum accelerates.
⸻
🔑 Key Takeaway
3,000 is a structural target—this means it’s a price objective that might play out over weeks, not hours.
Trying to catch that in one day is chasing a black swan.
Stay patient. Trade levels, not headlines.
⸻
⚠️ Disclaimer:
This post is for educational purposes only. Always do your own research before trading.
⸻
✅ If you found this helpful, share it with someone who panics every time a red candle shows up.
Alright, traders—before you start thinking the sky is falling, let’s look this chart straight in the face and get real.
⸻
🔍 The Setup Right Now
Here’s what’s showing up:
✅ A bullish pennant forming up top (potential continuation higher).
✅ A big head and shoulders pattern in the middle (bearish).
✅ VWAP bands ranging from ~3,257 to ~3,392.
✅ Volume is underwhelming—426k vs 582k average.
✅ A big target line all the way down near 3,000.
This mix of signals can be confusing. Let’s separate the hype from what’s actually possible.
⸻
🎯 Q: Can the market collapse to 3,000 tomorrow?
Short Answer:
No.
Here’s Why:
1️⃣ Move Size:
• Current price is ~3,357.
• Target is ~3,000.
• That’s a -357 point drop (~10.6%) in one session.
• For gold CFDs, this would be an extreme event only seen in major crises (think 2008 or March 2020).
2️⃣ Volume Context:
• Today’s volume is below average.
• Big crashes are usually preceded by heavy distribution—this isn’t showing yet.
3️⃣ VWAP Anchors:
• The lower VWAP band sits at 3,257.
• Reaching 3,000 would require breaking through 3,257 support, 3,100, and months of prior buying interest.
4️⃣ Market Environment:
• It’s the July 4th holiday in the U.S.—liquidity is thin.
• Thin markets can gap lower but rarely hold a massive drop without a big catalyst (e.g., credit crisis, war headlines).
5️⃣ Pattern Confirmation:
• Yes, the head and shoulders pattern is visible.
• But to confirm it, you need:
🔹 A clear break of the neckline with double average volume.
🔹 Follow-through that pushes below 3,257.
• None of this has happened yet.
⸻
✅ What’s Realistically Possible Tomorrow?
If sellers show up, here’s what a big bearish day might look like:
1️⃣ First Move:
• Rejection at 3,357–3,392 resistance.
• Pullback toward ~3,324 (mid VWAP).
2️⃣ Continuation:
• Drop down to ~3,257 (VWAP lower band).
3️⃣ Extreme Scenario:
• Retest of 3,200–3,150 zone.
But a flush all the way to 3,000?
👉 Highly unlikely unless there’s a major global shock.
⸻
💡 Trading Tip: Stay Tactical
If you want to position short:
✅ Wait for rejection at 3,357–3,392.
✅ Short targeting 3,324 first.
✅ Scale profits there.
✅ Only hold runners for 3,200–3,150 if momentum accelerates.
⸻
🔑 Key Takeaway
3,000 is a structural target—this means it’s a price objective that might play out over weeks, not hours.
Trying to catch that in one day is chasing a black swan.
Stay patient. Trade levels, not headlines.
⸻
⚠️ Disclaimer:
This post is for educational purposes only. Always do your own research before trading.
⸻
✅ If you found this helpful, share it with someone who panics every time a red candle shows up.
Mohamed
THE Ichimoku MAN on the Nile
#traders4traders
you are welcome to join my Telegram channel, Ichimokuonthenile.
for GOLD follow this link: t.me/GOLDontheNILE
youtube youtube.com/@ICHIMOKUontheNILE
THE Ichimoku MAN on the Nile
#traders4traders
you are welcome to join my Telegram channel, Ichimokuonthenile.
for GOLD follow this link: t.me/GOLDontheNILE
youtube youtube.com/@ICHIMOKUontheNILE
Related publications
Disclaimer
The information and publications are not meant to be, and do not constitute, financial, investment, trading, or other types of advice or recommendations supplied or endorsed by TradingView. Read more in the Terms of Use.