Analysis of the "Gold to Silver Ratio" will Reveal Curical Facts
Analysis on Weekly Timeframe:
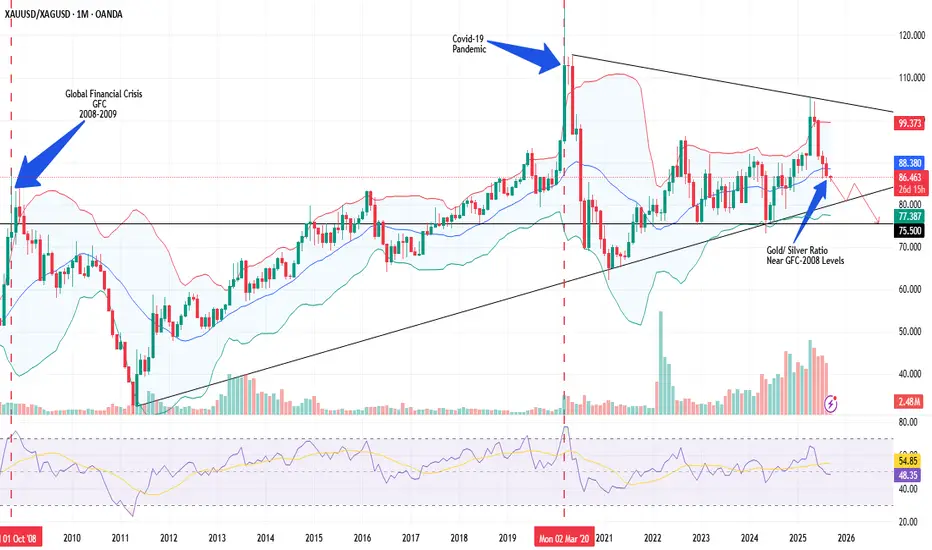
1. The ratio is trending within a symmetrical triangle pattern near 86.5.0, indicating gold is significantly more expensive relative to silver.
2. However, the ratio started declining after reaching peak of 105.5 during April, while testing the upper trend line of the triangle.
3. The ratio is expected to further fall & at least test the lower trendline of the triangle near 80.5, if breached, then support at 75.5 could be witnessed.
4. Currently, the ratio is trending near the levels previously seen during the Global Financial Crisis - 2008, after which it drastically declined.
Silver Shines Brighter Than Gold
---------------------------------------------------------------------------------------------------------------------
What is the Gold/Silver Ratio?
- The Gold/Silver ratio measures the value of gold in relation to silver.
- Basically, it tells us how many ounces of silver are needed to buy one ounce of gold.
- For example, if gold was trading at $1000 and silver was priced at $20, the gold : silver ratio would be 50.
- Current Situation - Gold Rate = ~$3500 & Silver = ~$40; the gold : silver ratio would be ~87.50
Interpretation
- A high ratio means gold is more expensive relative to silver (and vice versa)
- Historically, it has been seen that, when the ratio rises above 80 (currently it is 87.5), silver gets undervalued relative to gold
- An undervalued silver makes it a potential buy against gold.
Analysis on Weekly Timeframe:
1. The ratio is trending within a symmetrical triangle pattern near 86.5.0, indicating gold is significantly more expensive relative to silver.
2. However, the ratio started declining after reaching peak of 105.5 during April, while testing the upper trend line of the triangle.
3. The ratio is expected to further fall & at least test the lower trendline of the triangle near 80.5, if breached, then support at 75.5 could be witnessed.
4. Currently, the ratio is trending near the levels previously seen during the Global Financial Crisis - 2008, after which it drastically declined.
Silver Shines Brighter Than Gold
---------------------------------------------------------------------------------------------------------------------
What is the Gold/Silver Ratio?
- The Gold/Silver ratio measures the value of gold in relation to silver.
- Basically, it tells us how many ounces of silver are needed to buy one ounce of gold.
- For example, if gold was trading at $1000 and silver was priced at $20, the gold : silver ratio would be 50.
- Current Situation - Gold Rate = ~$3500 & Silver = ~$40; the gold : silver ratio would be ~87.50
Interpretation
- A high ratio means gold is more expensive relative to silver (and vice versa)
- Historically, it has been seen that, when the ratio rises above 80 (currently it is 87.5), silver gets undervalued relative to gold
- An undervalued silver makes it a potential buy against gold.
Certified Market Technician
WA: +33755531401
marketinvestopedia.com/
WA: +33755531401
marketinvestopedia.com/
Disclaimer
The information and publications are not meant to be, and do not constitute, financial, investment, trading, or other types of advice or recommendations supplied or endorsed by TradingView. Read more in the Terms of Use.