Gold technical analysis
Daily chart resistance 3350, support 3225
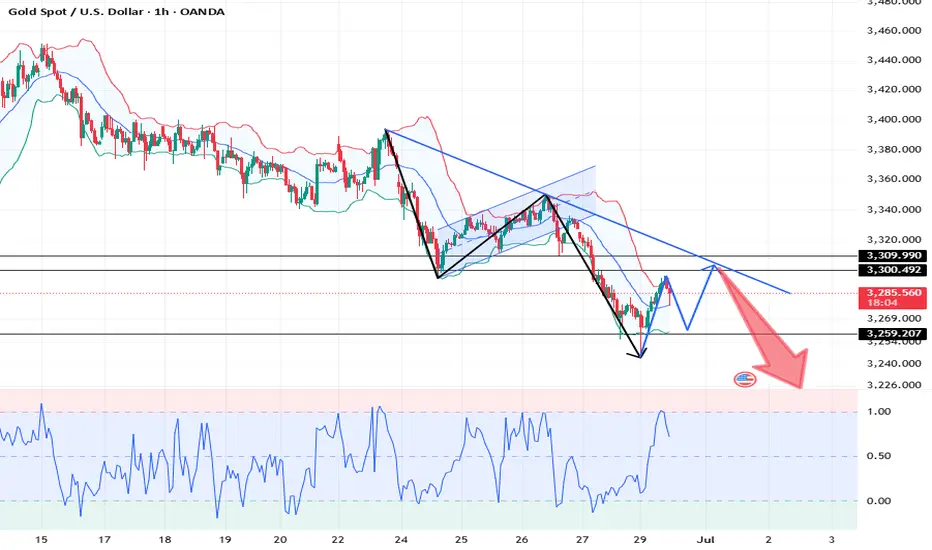
4-hour chart resistance 3310, support 3245
1-hour chart resistance 3295, support 3260
From the 4-hour level, after gold fell to 3255 last Friday, the real candlestick chart was difficult to continue to fall, suggesting that the downward momentum has slowed down. It is necessary to pay attention to the possibility of double bottom support at 3245. At the same time, this is also the 0.618 support level of the golden section of the 3120-3452 band. With the MACD showing signs of bottom divergence, short-term operations are bearish, but the probability of rebound is also very high. The short-term support position below the market is near 3281, and the break will look at 3260-3247; the important pressure position is near 3295; the break will look at 3309-3313!
BUY: 3281near
BUY: 3260near
BUY: 3245near
Daily chart resistance 3350, support 3225
4-hour chart resistance 3310, support 3245
1-hour chart resistance 3295, support 3260
From the 4-hour level, after gold fell to 3255 last Friday, the real candlestick chart was difficult to continue to fall, suggesting that the downward momentum has slowed down. It is necessary to pay attention to the possibility of double bottom support at 3245. At the same time, this is also the 0.618 support level of the golden section of the 3120-3452 band. With the MACD showing signs of bottom divergence, short-term operations are bearish, but the probability of rebound is also very high. The short-term support position below the market is near 3281, and the break will look at 3260-3247; the important pressure position is near 3295; the break will look at 3309-3313!
BUY: 3281near
BUY: 3260near
BUY: 3245near
Trade active
Gold fluctuates slightly, and you can make a profit by buying or selling.💥Telegram Channel Free Updates 👉🏻
💥t.me/Actuary00group
✉️Gold Signal and daily analysis channel
💥t.me/Actuary00group
✉️Gold Signal and daily analysis channel
Disclaimer
The information and publications are not meant to be, and do not constitute, financial, investment, trading, or other types of advice or recommendations supplied or endorsed by TradingView. Read more in the Terms of Use.
💥Telegram Channel Free Updates 👉🏻
💥t.me/Actuary00group
✉️Gold Signal and daily analysis channel
💥t.me/Actuary00group
✉️Gold Signal and daily analysis channel
Disclaimer
The information and publications are not meant to be, and do not constitute, financial, investment, trading, or other types of advice or recommendations supplied or endorsed by TradingView. Read more in the Terms of Use.