Market news:
This week, the international gold price staged a "roller coaster" market. Spot gold continued to rise from Monday to Thursday, and on Thursday (April 3), it hit a record high of $3,167/ounce, but on Friday (April 4), it plummeted by more than $75 in a single day, falling to a low of $3,015, a drop of 2.44%, and finally closed at $3,038/ounce, narrowing the weekly increase to 1.2%. Precious metals such as silver and platinum fell simultaneously, among which spot silver fell by 7.2% in a single week, the worst performance since September 2020. This sharp fluctuation stems from two key events: Trump's tariff policy has caused global concerns to heat up, and Federal Reserve Chairman Powell's unexpected turn to hawkish monetary policy. The market liquidity crisis caused investors to sell gold to make up for stock market losses, and the US dollar index strengthened by 0.9%, further suppressing international gold prices. The better-than-expected non-farm payrolls report released by the United States on Friday was another reason for the blow to gold prices. The U.S. Department of Labor reported that after seasonal adjustment, non-farm payrolls in March recorded 228,000, an increase higher than the market expectation of 135,000. Non-farm payrolls data will help the Federal Reserve postpone interest rate cuts. International gold usually performs well in a low interest rate environment. Looking ahead to next week, investors need to focus on the verification of inflation expectations by the U.S. CPI data in March (April 10), the market reaction after the tariff measures are officially implemented, and whether the speeches of Fed officials will release more policy signals.
Technical Review:
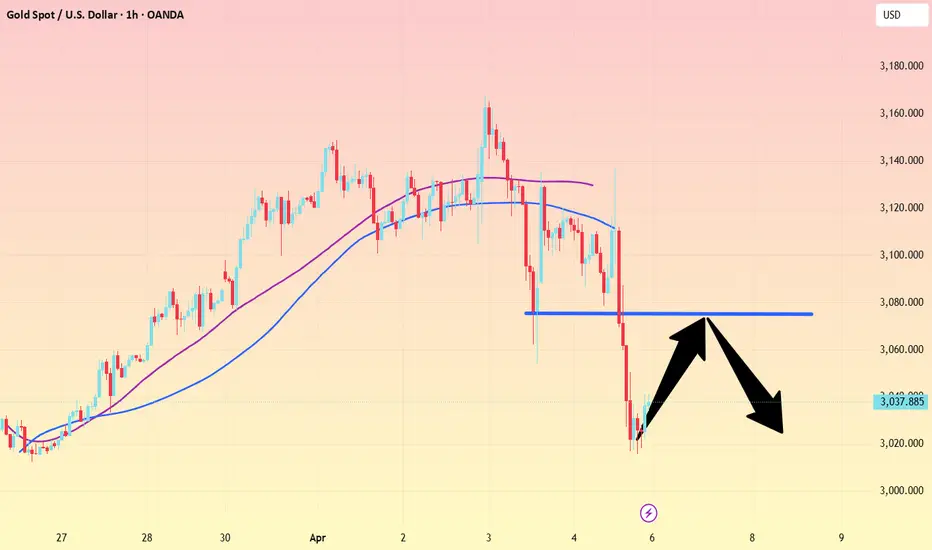
After a series of large negative declines, gold is currently in a short-term trend that is bearish. The daily line has a large negative downward trend, breaking the short-term moving average and piercing the middle track, leaving a lower shadow below. The pattern shows a bearish signal of Yin Bao Yang engulfing. In the short term, it may rely on the middle track support to confirm the 10ma resistance and fall again. The 4-hour Bollinger Bands open downward, and the K-line continues to decline. The trend is bearish and downward. The gold market on Thursday and Friday this week can be described as thrilling, with a rise and fall of more than 200 points in two days! The gold market has changed suddenly, and there has been an extremely violent sweep. First, it rose rapidly to 3136 without any signs, and then fell back quickly at lightning speed, and fell below the intraday low. At present, the daily gold line has risen and fallen. The sharp rise in the early trading did not continue. It was under pressure at the high of 3168 and quickly entered an adjustment, with a downward adjustment space of more than 100 US dollars. After the high-level fluctuations of gold in the past two days, gold finally broke down on Friday night. In fact, the market was too active in the past two days, and the overall volatility was large. In fact, it was still a little difficult to operate. Although the overall outlook was bearish, the rebound amplitude was not small each time. Now sometimes it rebounded by more than 20 US dollars in a few minutes, so it may appear that it will continue to fall after a just loss. Now the high level of the gold daily line is covered by dark clouds, so how to operate next week?
Next week's analysis:
From the overall trend, the weak pattern of gold is beyond doubt, and it is reasonable to continue to be under pressure and downward. Therefore, it is recommended to pay attention to the 3050-3054 area next week, and continue to look at the 3060-3070 area above. The support that needs to be focused on is the 3000 mark shown by the weekly 5-day moving average slightly moving down. Above it, it will rebound, and breaking it will open a new round of downward space. The gold 1-hour moving average has formed a dead cross downward, so the gold bears still have power. The short-term gold can only rebound. After the gold rebounds, it will continue to sell, and then gold will enter a shock. After the gold falls sharply from a high level, it is more advantageous to sell in the short term. Unless there is a big profit to buy, it is difficult for gold to rise directly. The last physical K-line box of gold in the 1 hour will form a short-term suppression. The gold rebound resistance is 3076. If it is under pressure, then the gold rebound will continue to sell at highs.
Operation ideas:
Buy short-term gold at 3013-3015, stop loss at 3004, target at 3050-3060;
Sell short-term gold at 3063-3065, stop loss at 3075, target at 3020-3030;
Key points:
First support level: 3015, second support level: 3000, third support level: 2988
First resistance level: 3048, second resistance level: 3056, third resistance level: 3074
This week, the international gold price staged a "roller coaster" market. Spot gold continued to rise from Monday to Thursday, and on Thursday (April 3), it hit a record high of $3,167/ounce, but on Friday (April 4), it plummeted by more than $75 in a single day, falling to a low of $3,015, a drop of 2.44%, and finally closed at $3,038/ounce, narrowing the weekly increase to 1.2%. Precious metals such as silver and platinum fell simultaneously, among which spot silver fell by 7.2% in a single week, the worst performance since September 2020. This sharp fluctuation stems from two key events: Trump's tariff policy has caused global concerns to heat up, and Federal Reserve Chairman Powell's unexpected turn to hawkish monetary policy. The market liquidity crisis caused investors to sell gold to make up for stock market losses, and the US dollar index strengthened by 0.9%, further suppressing international gold prices. The better-than-expected non-farm payrolls report released by the United States on Friday was another reason for the blow to gold prices. The U.S. Department of Labor reported that after seasonal adjustment, non-farm payrolls in March recorded 228,000, an increase higher than the market expectation of 135,000. Non-farm payrolls data will help the Federal Reserve postpone interest rate cuts. International gold usually performs well in a low interest rate environment. Looking ahead to next week, investors need to focus on the verification of inflation expectations by the U.S. CPI data in March (April 10), the market reaction after the tariff measures are officially implemented, and whether the speeches of Fed officials will release more policy signals.
Technical Review:
After a series of large negative declines, gold is currently in a short-term trend that is bearish. The daily line has a large negative downward trend, breaking the short-term moving average and piercing the middle track, leaving a lower shadow below. The pattern shows a bearish signal of Yin Bao Yang engulfing. In the short term, it may rely on the middle track support to confirm the 10ma resistance and fall again. The 4-hour Bollinger Bands open downward, and the K-line continues to decline. The trend is bearish and downward. The gold market on Thursday and Friday this week can be described as thrilling, with a rise and fall of more than 200 points in two days! The gold market has changed suddenly, and there has been an extremely violent sweep. First, it rose rapidly to 3136 without any signs, and then fell back quickly at lightning speed, and fell below the intraday low. At present, the daily gold line has risen and fallen. The sharp rise in the early trading did not continue. It was under pressure at the high of 3168 and quickly entered an adjustment, with a downward adjustment space of more than 100 US dollars. After the high-level fluctuations of gold in the past two days, gold finally broke down on Friday night. In fact, the market was too active in the past two days, and the overall volatility was large. In fact, it was still a little difficult to operate. Although the overall outlook was bearish, the rebound amplitude was not small each time. Now sometimes it rebounded by more than 20 US dollars in a few minutes, so it may appear that it will continue to fall after a just loss. Now the high level of the gold daily line is covered by dark clouds, so how to operate next week?
Next week's analysis:
From the overall trend, the weak pattern of gold is beyond doubt, and it is reasonable to continue to be under pressure and downward. Therefore, it is recommended to pay attention to the 3050-3054 area next week, and continue to look at the 3060-3070 area above. The support that needs to be focused on is the 3000 mark shown by the weekly 5-day moving average slightly moving down. Above it, it will rebound, and breaking it will open a new round of downward space. The gold 1-hour moving average has formed a dead cross downward, so the gold bears still have power. The short-term gold can only rebound. After the gold rebounds, it will continue to sell, and then gold will enter a shock. After the gold falls sharply from a high level, it is more advantageous to sell in the short term. Unless there is a big profit to buy, it is difficult for gold to rise directly. The last physical K-line box of gold in the 1 hour will form a short-term suppression. The gold rebound resistance is 3076. If it is under pressure, then the gold rebound will continue to sell at highs.
Operation ideas:
Buy short-term gold at 3013-3015, stop loss at 3004, target at 3050-3060;
Sell short-term gold at 3063-3065, stop loss at 3075, target at 3020-3030;
Key points:
First support level: 3015, second support level: 3000, third support level: 2988
First resistance level: 3048, second resistance level: 3056, third resistance level: 3074
Disclaimer
The information and publications are not meant to be, and do not constitute, financial, investment, trading, or other types of advice or recommendations supplied or endorsed by TradingView. Read more in the Terms of Use.
Disclaimer
The information and publications are not meant to be, and do not constitute, financial, investment, trading, or other types of advice or recommendations supplied or endorsed by TradingView. Read more in the Terms of Use.