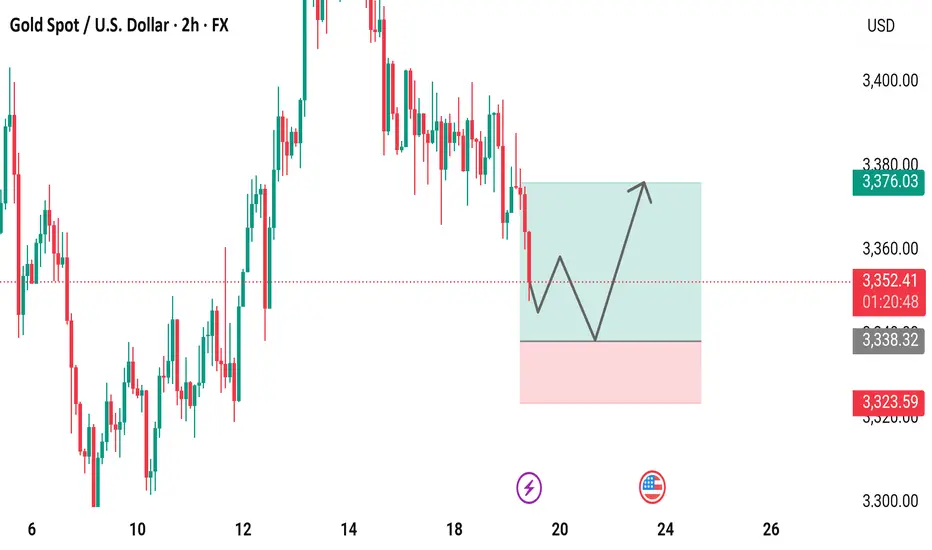
2-hour chart displays the price movement of Gold Spot (XAUUSD) against the U.S. Dollar, showing a current price of $3,352.73 with a decrease of $16.20 (-0.48%) as of 01:22:11. The chart highlights a recent downward trend following a peak, with a shaded area indicating a potential support or resistance zone around $3,360 to $3,400. Key price levels are marked, including $3,400.00, $3,376.03, and $3,323.59, with candlestick patterns reflecting market volatility.
Trade active
Target achieved Trade closed: target reached
Target achieved Daily XAU/USD FREE setups | Let's grow together!
| XAU/USD Trader | Telegram: https://t.me/Aleegoldsignals
| XAU/USD Trader | Telegram: https://t.me/Aleegoldsignals
Disclaimer
The information and publications are not meant to be, and do not constitute, financial, investment, trading, or other types of advice or recommendations supplied or endorsed by TradingView. Read more in the Terms of Use.
Daily XAU/USD FREE setups | Let's grow together!
| XAU/USD Trader | Telegram: https://t.me/Aleegoldsignals
| XAU/USD Trader | Telegram: https://t.me/Aleegoldsignals
Disclaimer
The information and publications are not meant to be, and do not constitute, financial, investment, trading, or other types of advice or recommendations supplied or endorsed by TradingView. Read more in the Terms of Use.