XAU/USD Price Action Analysis – Bullish Breakout Setup 🚀
🔍 Chart Overview:
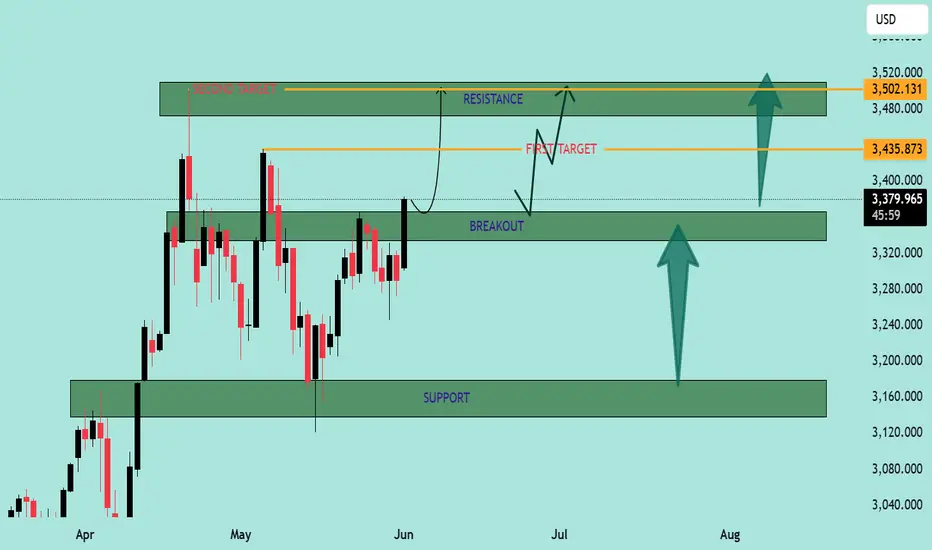
This chart illustrates the price movement of XAU/USD (Gold vs USD) on a mid-term time frame, highlighting a potential bullish breakout scenario from a key resistance zone.
🟩 Key Levels:
Support Zone: 🛡️
➤ $3,140 – $3,200
This zone has acted as a strong support multiple times, preventing further declines and serving as a springboard for bullish moves.
Breakout Zone (Current Level): ⚡
➤ $3,340 – $3,390
Price is currently testing this crucial resistance-turned-potential-breakout zone. A successful close above this level could confirm bullish continuation.
First Target: 🎯
➤ $3,435.87
This intermediate resistance aligns with a previously tested high. It may act as the first barrier after the breakout.
Second Target: 🥇
➤ $3,502.13
This is the major resistance zone. If bulls maintain momentum, this area will likely be tested.
🧭 Market Structure & Bias:
Price is forming higher lows, signaling growing bullish strength.
The chart shows a bullish breakout of a sideways consolidation zone.
The upward arrows and curved projection suggest a potential pullback-retest scenario at the breakout level before rallying towards targets.
🧠 Trading Plan (Illustrated by Chart):
📈 Breakout Entry:
Wait for confirmation above $3,390 with strong bullish candles and volume.
🔁 Retest Opportunity:
If price pulls back to the breakout zone ($3,340 – $3,390), this may serve as a solid re-entry point for long positions.
🎯 Profit Targets:
TP1: $3,435
TP2: $3,502
🛑 Invalidation:
A strong close back below $3,320 may invalidate the bullish bias.
📌 Conclusion:
The chart indicates a bullish continuation setup for XAU/USD with clearly defined breakout, retest, and target zones. Traders should monitor price action closely around the breakout area for confirmation before entering long positions. Risk management remains key. 🧮⚖️
🔍 Chart Overview:
This chart illustrates the price movement of XAU/USD (Gold vs USD) on a mid-term time frame, highlighting a potential bullish breakout scenario from a key resistance zone.
🟩 Key Levels:
Support Zone: 🛡️
➤ $3,140 – $3,200
This zone has acted as a strong support multiple times, preventing further declines and serving as a springboard for bullish moves.
Breakout Zone (Current Level): ⚡
➤ $3,340 – $3,390
Price is currently testing this crucial resistance-turned-potential-breakout zone. A successful close above this level could confirm bullish continuation.
First Target: 🎯
➤ $3,435.87
This intermediate resistance aligns with a previously tested high. It may act as the first barrier after the breakout.
Second Target: 🥇
➤ $3,502.13
This is the major resistance zone. If bulls maintain momentum, this area will likely be tested.
🧭 Market Structure & Bias:
Price is forming higher lows, signaling growing bullish strength.
The chart shows a bullish breakout of a sideways consolidation zone.
The upward arrows and curved projection suggest a potential pullback-retest scenario at the breakout level before rallying towards targets.
🧠 Trading Plan (Illustrated by Chart):
📈 Breakout Entry:
Wait for confirmation above $3,390 with strong bullish candles and volume.
🔁 Retest Opportunity:
If price pulls back to the breakout zone ($3,340 – $3,390), this may serve as a solid re-entry point for long positions.
🎯 Profit Targets:
TP1: $3,435
TP2: $3,502
🛑 Invalidation:
A strong close back below $3,320 may invalidate the bullish bias.
📌 Conclusion:
The chart indicates a bullish continuation setup for XAU/USD with clearly defined breakout, retest, and target zones. Traders should monitor price action closely around the breakout area for confirmation before entering long positions. Risk management remains key. 🧮⚖️
JOIN MY TELEGRAM CHANNEL
t.me/StellarMarketAnalysis
JOIN MY RECOMMENTED BROKER REFFREL LINK
⤵️one.exnesstrack.net/a/uvd1etcgg1
PARTNER CODE⤵️
uvd1etcgg1
t.me/StellarMarketAnalysis
JOIN MY RECOMMENTED BROKER REFFREL LINK
⤵️one.exnesstrack.net/a/uvd1etcgg1
PARTNER CODE⤵️
uvd1etcgg1
Disclaimer
The information and publications are not meant to be, and do not constitute, financial, investment, trading, or other types of advice or recommendations supplied or endorsed by TradingView. Read more in the Terms of Use.