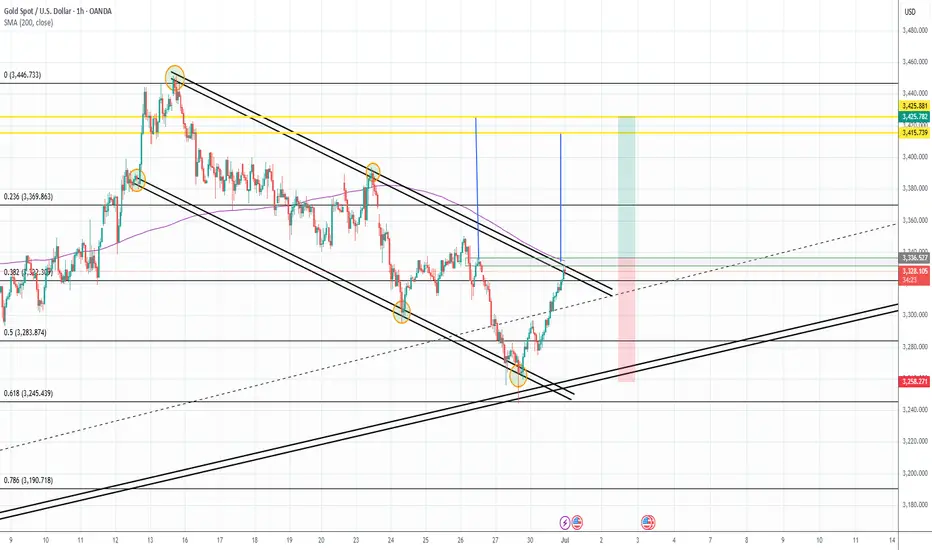
Gold dropped to the 61% Fibonacci retracement level, aligning with the long-term ascending trendline, where it showed a strong bullish rejection.
Currently, price is breaking out of the descending channel and the 200 SMA, and is beginning to form a potential bullish spike formation.
If this pattern completes and breaks to the upside, we would have three confluencing technical signals pointing to a possible target area around $3,425.881.
📌 I’ll wait for a confirmed breakout of the bullish spike to look for long entries.
Disclaimer
The information and publications are not meant to be, and do not constitute, financial, investment, trading, or other types of advice or recommendations supplied or endorsed by TradingView. Read more in the Terms of Use.
Disclaimer
The information and publications are not meant to be, and do not constitute, financial, investment, trading, or other types of advice or recommendations supplied or endorsed by TradingView. Read more in the Terms of Use.