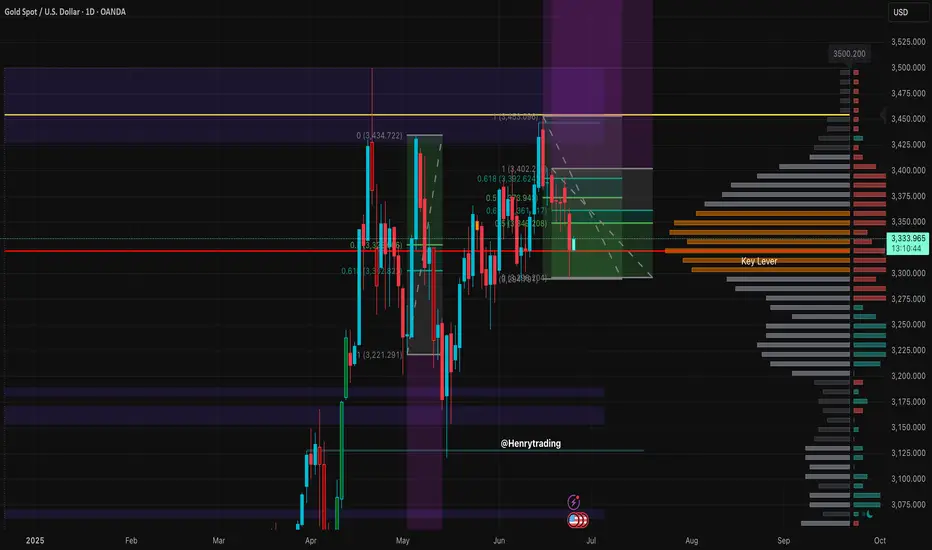
After a sharp decline in the previous session, XAUUSD has shown a mild recovery and is currently trading around 3,332 USD. However, price action suggests this could merely be a pullback within a broader downtrend, as gold has yet to break above the key resistance zone.
Technical Analysis
Price Action
Gold has bounced from the support zone between 3,291 – 3,317 USD, which has historically acted as a strong demand area. This zone also aligns with the Fibonacci 0.382 retracement from the previous bullish leg.
However, XAUUSD remains below the key resistance zone at 3,373 – 3,392 USD, which is a confluence of:
- The Fibonacci 0.618 retracement from the most recent downtrend
- A historical supply zone that has been rejected multiple times
- The upper boundary of the sideways range formed since May
- If price fails to break through this zone in the coming sessions, the risk of continued downside remains high.
RSI Indicator
- The RSI (14) is currently hovering around the neutral zone (49–54), indicating that the rebound lacks the strength needed to confirm a trend reversal.
- The RSI has not crossed above the 55 threshold, suggesting the dominant trend is still bearish.
Key Technical Levels to Watch
Resistance:
- 3,373 – 3,392 USD: Confluent resistance zone (Fibonacci 0.618 + prior supply zone)
- 3,435 – 3,452 USD: Major swing high, a key medium-term reference level
Support:
- 3,291 – 3,317 USD: Immediate support zone, still holding strong
- 3,250 – 3,224 USD: Potential downside target if the bearish momentum resumes
Suggested Trade Setups
Scenario 1 – Buy if price holds above 3,291 and shows confirmation signals
Entry: 3,295 – 3,300 USD
Stop-loss: Below 3,289 USD
Take-profit: 3,340 – 3,355 – 3,370 USD
Conditions: Must show clear bullish reversal patterns (Pin Bar, Bullish Engulfing) on H1 or H4 timeframe
Scenario 2 – Sell if price rejects from resistance zone with confirmation candle
Entry: 3,370 – 3,375 USD
Stop-loss: Above 3,392 USD
Take-profit: 3,330 – 3,310 – 3,290 USD
Conditions: Clear bearish rejection candle + declining volume
Note: XAUUSD is currently in a technical rebound phase after a strong drop but lacks solid reversal confirmation. Traders should closely monitor the price reaction near the 3,373 – 3,392 USD resistance zone over the next sessions. This area will determine whether the downtrend will resume or a reversal begins.
Stay tuned for more daily trading strategies, and make sure to save this analysis if you find it helpful for your trading plan.
Strategy analysis by Henrybillion
Trade active
Everyone has their own strategy – are you watching for a buy or a sell at this price zone?🪙 JOIN OUR FREE TELEGRAM GROUP 🪙
t.me/dnaprofits
Join the community group to get support and share knowledge!
️🥇 Exchange and learn market knowledge
️🥇 Support free trading signals
t.me/dnaprofits
Join the community group to get support and share knowledge!
️🥇 Exchange and learn market knowledge
️🥇 Support free trading signals
Related publications
Disclaimer
The information and publications are not meant to be, and do not constitute, financial, investment, trading, or other types of advice or recommendations supplied or endorsed by TradingView. Read more in the Terms of Use.
🪙 JOIN OUR FREE TELEGRAM GROUP 🪙
t.me/dnaprofits
Join the community group to get support and share knowledge!
️🥇 Exchange and learn market knowledge
️🥇 Support free trading signals
t.me/dnaprofits
Join the community group to get support and share knowledge!
️🥇 Exchange and learn market knowledge
️🥇 Support free trading signals
Related publications
Disclaimer
The information and publications are not meant to be, and do not constitute, financial, investment, trading, or other types of advice or recommendations supplied or endorsed by TradingView. Read more in the Terms of Use.