1. Analysis of gold news
China-US trade negotiations ease risk aversion
The second round of China-US trade negotiations was held in London. Both sides released "constructive" signals. The market expects that tariff policies may be further eased, weakening the safe-haven demand for gold.
U.S. Treasury Secretary Bensont called the talks "good" and Commerce Secretary Lutnick described the discussions as "fruitful". The market is cautiously optimistic about the negotiations, and gold is under pressure to fall.
The trend of the US dollar and the impact of the Fed's policies
The US dollar index has recently fluctuated in the range of 99-102. If it strengthens further (such as breaking through 102), it may suppress gold prices; on the contrary, if it falls below 99, gold may stabilize and rebound.
The Fed may keep interest rates unchanged at its June meeting. The market expects a high probability of a rate cut before September, but if the US economic data is strong (such as non-farm employment exceeding expectations), the rate cut may be postponed, which is bearish for gold.
Central bank gold purchases slowed down, but long-term support remains
The People's Bank of China increased its gold holdings by 60,000 ounces in May, with a slower growth rate than in previous months. Short-term support for gold prices weakened, but the long-term trend of de-dollarization still supports gold demand.
2. Technical analysis of gold
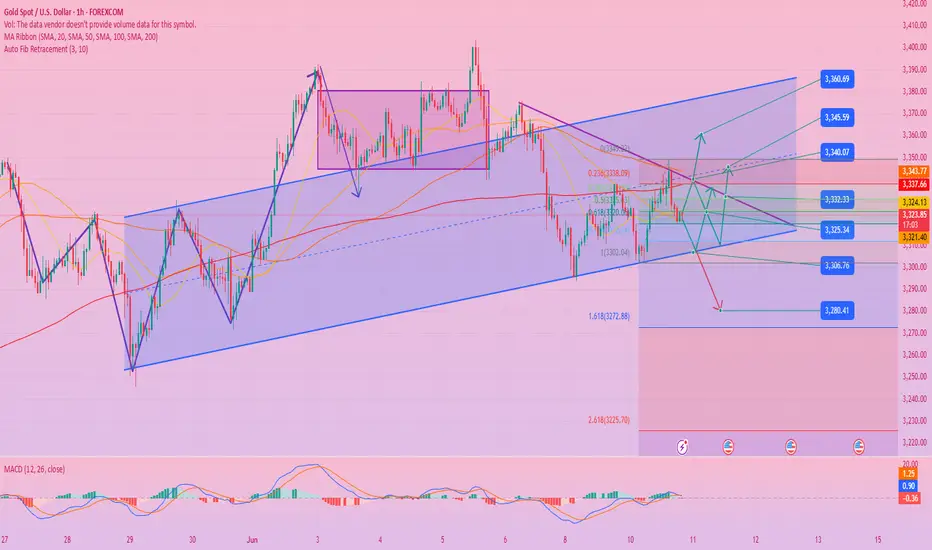
Short-term oscillating downward trend
Gold prices hit 3348 and then fell back, failing to stand firm at 3345 resistance, indicating that bears still have the upper hand.
The 1-hour chart shows a oscillating downward trend, with 3345-3355 constituting strong resistance and 3300-3310 as key support. If it falls below 3300, it may accelerate to the 3280-3250 range.
Key support and resistance
Upper resistance: 3345-3355 (suppression by yesterday's high and trend line)
Lower support: 3300-3310 (psychological barrier and 30-day moving average), if it falls below, look at 3280-3250.
Operation strategy
Short-term short orders: If the price rebounds to the range of 3345-3355, you can try to short sell, with a target of 3310-3300.
Short-term long orders: If the support of 3300 is effective, you can buy with a light position to rebound and rise, with a target of 3320-3330.
Trend trading: If it falls below 3300, you can follow up with short orders, with a target of 3280-3250.
3. Outlook for the future
Short-term range: Gold prices may fluctuate in the range of 3200-3400, affected by the Fed's policy expectations, the trend of the US dollar and the geopolitical situation.
Medium- to long-term: If the Fed starts a rate cut cycle or geopolitical risks escalate (such as the deterioration of the situation in the Middle East), gold may hit the high point of 3400-3500 again.
Conclusion: Today, gold is mainly shorted on rebound, with attention paid to the resistance of 3345-3355, and the target below is 3310-3300. If it falls below, a deeper correction will be seen.
Trade active
From a technical perspective:
❶: From the daily level: the Bollinger band opening is narrowing, and the price is running above the middle track, suggesting that volatility is reduced and long and short positions are temporarily balanced. The MACD indicator double lines are running above the zero axis, and the bullish momentum is weakened. The RSI value is in the range of 53-55, which is in the neutral and bullish area. Overall, gold is currently oscillating, and attention should be paid to the subsequent breakthrough direction.
❷: On the 4-hour level: the Bollinger band is narrowing, indicating that volatility is reduced. The MACD upward momentum column is expanding, and the bullish momentum is increasing. The RSI indicator is in the range of 50-58, which is bullish but has a weak advantage, and is oscillating overall.
❸: On the hourly level: the Bollinger band is flat, the price is above the middle track, the volatility is reduced, and the long and short positions tend to be balanced. The 5- and 21-day moving averages are entangled, and the direction is unclear. MACD is running above the zero axis, the downward momentum column is shrinking, and the bearish momentum is weakened. The RSI value is in the range of 52-56, with no obvious advantage, and is oscillating overall.
Looking forward to the future operation of gold:
Relying on the pressure level of 3380 USD/ounce on the upper side, shorting around 3365-3355 USD/ounce after the pressure;
Relying on the strong support of 3280 USD/ounce on the lower side, longing around 3295-3305 USD/ounce after stabilization.
Related publications
Disclaimer
The information and publications are not meant to be, and do not constitute, financial, investment, trading, or other types of advice or recommendations supplied or endorsed by TradingView. Read more in the Terms of Use.
Related publications
Disclaimer
The information and publications are not meant to be, and do not constitute, financial, investment, trading, or other types of advice or recommendations supplied or endorsed by TradingView. Read more in the Terms of Use.