Chart Overview:
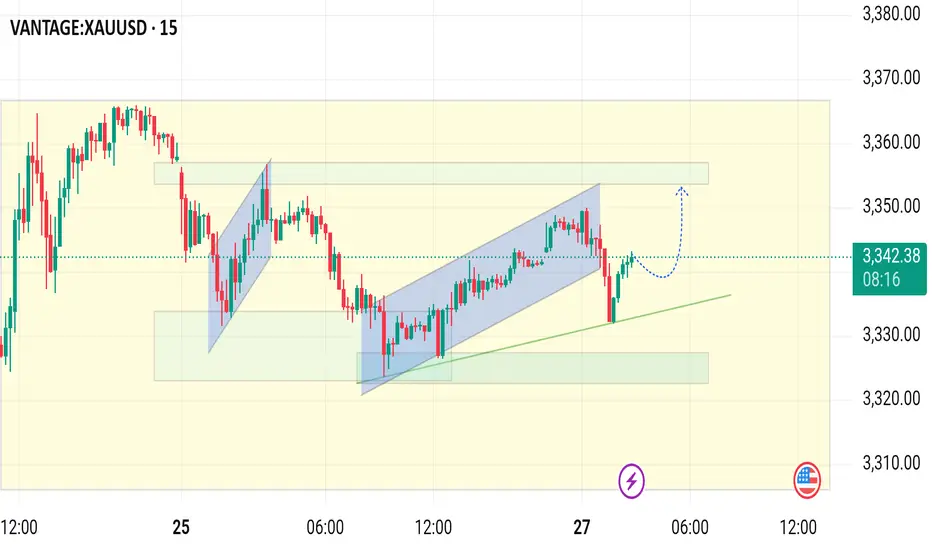
Instrument: (XAU/USD)
Timeframe: 15-minute
Current Price: $3,341.07
Price Action: Market recently exited a rising channel and is currently consolidating near the upper zone of a prior accumulation range.
---
Key Technical Observations:
1. Rising Channel (Bullish Trend Continuation):
A rising channel broke down recently, suggesting short-term weakness.
However, price is still holding above the diagonal trendline support (green).
2. Support and Demand Zone (Green Box around 3,325 – 3,330):
This lower area previously acted as a demand zone where buying interest emerged.
Price respected this zone multiple times, reinforcing it as strong short-term support.
3. Current Consolidation Near Resistance:
Price is consolidating just below a minor resistance zone (~3,350).
The dotted blue arrow suggests an anticipated bullish breakout toward the upper resistance band (~3,355–3,360).
4. Price Structure Suggests Higher Lows:
A series of higher lows is forming, hinting at potential bullish pressure building.
5. Indicators Not Visible:
No RSI, MACD, or volume are visible in this chart, which would be helpful for confirmation.
Based on price action alone, buyers are gaining strength near the trendline support.
---
Potential Trading Plan:
Bullish Scenario:
Entry: Upon bullish breakout above ~$3,345–3,348
Target: ~$3,355–3,360 (previous supply zone)
Stop: Below the trendline or $3,330 to minimize risk
Bearish Scenario (if support fails):
Entry: Break and close below ~$3,330
Target: Revisit of lower green zone ~$3,320
Stop: Above $3,340
t.me/htGGOLD_SOUK_Trd
🟢All Pairs Signals Provided
🟡XAUUSD AND CRYPTO
✅Just Register now and Enjoy
✅No swap & No commission
one.exnesstrack.org/a/siuhoykv4s
🟢All Pairs Signals Provided
🟡XAUUSD AND CRYPTO
✅Just Register now and Enjoy
✅No swap & No commission
one.exnesstrack.org/a/siuhoykv4s
Disclaimer
The information and publications are not meant to be, and do not constitute, financial, investment, trading, or other types of advice or recommendations supplied or endorsed by TradingView. Read more in the Terms of Use.