✅ On the daily chart, gold closed with a strong bullish candle, breaking out to the 3448 level and testing the previous high resistance zone at 3450–3470. The price is firmly above the upper Bollinger Band, indicating strong bullish momentum, but there are short-term overbought signals. The MACD lines have formed a golden cross with expanding histogram bars, confirming the bullish trend. However, the KDJ is overextended (K > 90), suggesting the risk of a short-term pullback.
Overall, the daily chart remains bullish, but with price approaching key resistance, a correction could occur at any time.
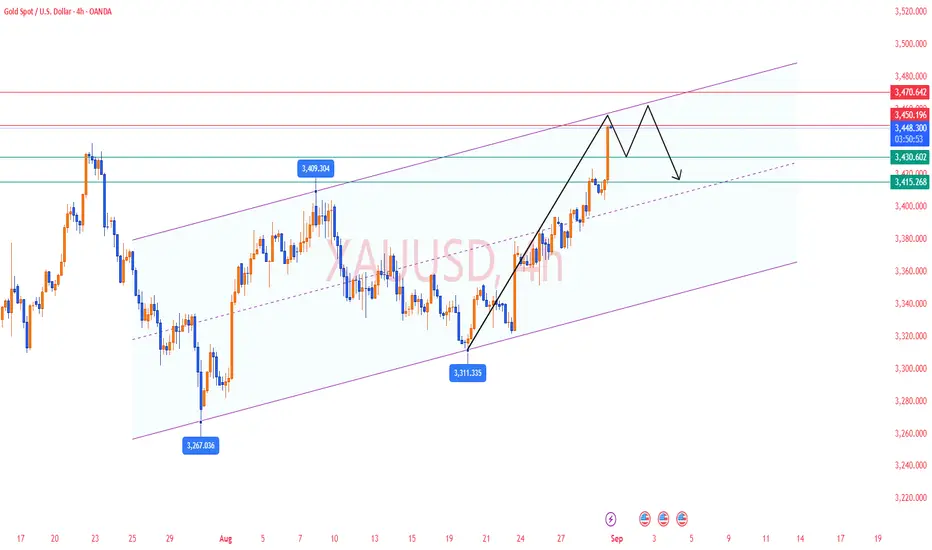
✅ On the 4-hour chart, the price has surged from 3311 and climbed all the way up to 3448. It is now trading outside the upper Bollinger Band, showing clear signs of overheating in the short term. While MACD momentum remains strong, there are early signs of topping out. A technical pullback is likely, with key support to watch at 3430–3415.
🔴 Resistance: 3450–3470
🟢 Support: 3430–3415
✅ Trading Strategy Reference:
🔰 Aggressive Strategy: If the price breaks above 3470 and holds, further upside could extend toward 3500 and beyond.
🔰 Conservative Strategy: If the price pulls back to 3430–3415 and holds, consider entering long positions with targets at 3460–3470. If 3415 fails, shift to a high-level short strategy.
🔥Trading Reminder: Trading strategies are time-sensitive, and market conditions can change rapidly. Please adjust your trading plan based on real-time market conditions🤝
Overall, the daily chart remains bullish, but with price approaching key resistance, a correction could occur at any time.
✅ On the 4-hour chart, the price has surged from 3311 and climbed all the way up to 3448. It is now trading outside the upper Bollinger Band, showing clear signs of overheating in the short term. While MACD momentum remains strong, there are early signs of topping out. A technical pullback is likely, with key support to watch at 3430–3415.
🔴 Resistance: 3450–3470
🟢 Support: 3430–3415
✅ Trading Strategy Reference:
🔰 Aggressive Strategy: If the price breaks above 3470 and holds, further upside could extend toward 3500 and beyond.
🔰 Conservative Strategy: If the price pulls back to 3430–3415 and holds, consider entering long positions with targets at 3460–3470. If 3415 fails, shift to a high-level short strategy.
🔥Trading Reminder: Trading strategies are time-sensitive, and market conditions can change rapidly. Please adjust your trading plan based on real-time market conditions🤝
✅𝐃𝐚𝐢𝐥𝐲 𝟐-𝟒 𝐓𝐫𝐚𝐝𝐢𝐧𝐠 𝐒𝐢𝐠𝐧𝐚𝐥𝐬🔥
✅𝐇𝐢𝐠𝐡 𝐀𝐜𝐜𝐮𝐫𝐚𝐜𝐲 𝟗𝟎%-𝟗𝟓% 🔥
✅𝐖𝐞𝐞𝐤𝐥𝐲 𝐲𝐢𝐞𝐥𝐝 𝟔𝟎%-𝟖𝟓%🔥
👉Free Channel:t.me/+AMHhMKEIj_IzN2Vl
✉️VIP Guidance : t.me/Jack_blackwell
✅𝐇𝐢𝐠𝐡 𝐀𝐜𝐜𝐮𝐫𝐚𝐜𝐲 𝟗𝟎%-𝟗𝟓% 🔥
✅𝐖𝐞𝐞𝐤𝐥𝐲 𝐲𝐢𝐞𝐥𝐝 𝟔𝟎%-𝟖𝟓%🔥
👉Free Channel:t.me/+AMHhMKEIj_IzN2Vl
✉️VIP Guidance : t.me/Jack_blackwell
Disclaimer
The information and publications are not meant to be, and do not constitute, financial, investment, trading, or other types of advice or recommendations supplied or endorsed by TradingView. Read more in the Terms of Use.