**Gold (XAU/USD) Chart Analysis**
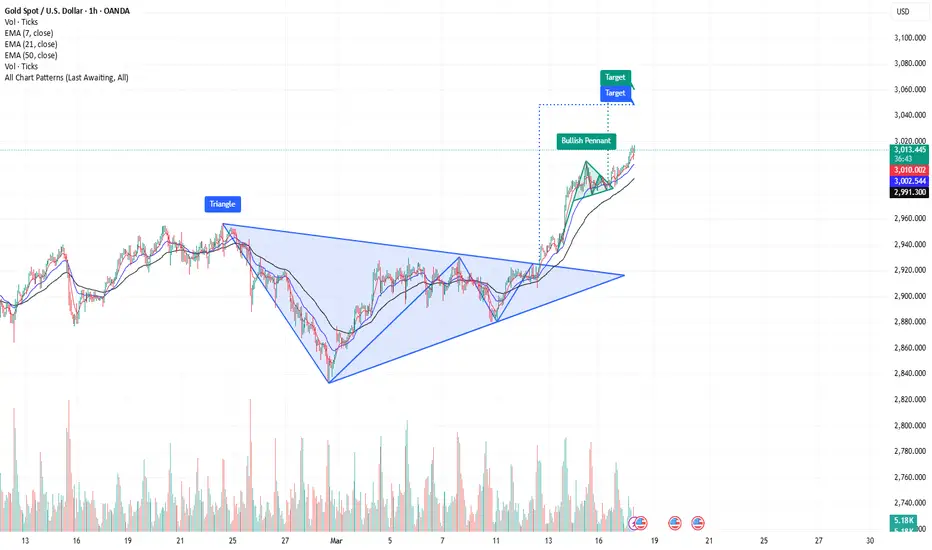
📌 **Current Price:** $3,014.41
📊 **Chart Pattern:** Uptrend with Higher Highs & Higher Lows
🎯 **Short-Term Target:** $3,020
**🔹 Key Levels:**
- **Support:**
- $3,012 (7 EMA)
- $3,008 (21 EMA)
- $3,003 (50 EMA)
- **Resistance:**
- $3,015 (Immediate)
- $3,020 (Psychological Level)
**✅ Trade Setup (Scalping Strategy):**
- **Entry:** On retracement near $3,012 (7 EMA)
- **Stop-Loss:** Below $3,008
- **Take Profit:** $3,020
📢 **Gold is in a strong uptrend. Bullish momentum remains intact unless price drops below $3,008!** 🚀https://tradingview.sweetlogin.com/x/sFRuLlep/
Trade active
- **Target Reached**: 3028- **Action Options**:
- **Close All Trades**: Lock in your profit at 3028.
- **Set Break-Even**: Move the stop-loss to 3011 to secure the position in case of a reversal.
The trade has hit the target, and now it’s about managing risk by either securing your profit or allowing for more potential upside while minimizing losses.
Trade closed: target reached
close all tradesNote
Gold has surged to **3037**, marking a new **All-Time High (ATH)**! 🚀 **Key Takeaways:**
- **Strong bullish momentum** has pushed gold beyond previous resistance levels.
- The breakout could indicate **further upside** if momentum sustains.
- **Potential retracement** or consolidation might occur before another leg up.
**Next Levels to Watch:**
- **Support:** 3020 - 3030 (recent breakout zone)
- **Resistance:** 3050 - 3070 (potential next targets)
Disclaimer
The information and publications are not meant to be, and do not constitute, financial, investment, trading, or other types of advice or recommendations supplied or endorsed by TradingView. Read more in the Terms of Use.
Disclaimer
The information and publications are not meant to be, and do not constitute, financial, investment, trading, or other types of advice or recommendations supplied or endorsed by TradingView. Read more in the Terms of Use.