7.11 Gold Analysis
At present, the long and short forces are in a tug-of-war between three key factors:
1. Expectations of Fed rate cuts (core support)
Latest developments: Fed Governor Waller strongly called for a rate cut in July, but the market expects a rate cut in September with a probability of over 70% (CME data). The chairman of the San Francisco Fed expressed support for two rate cuts this year to ease inflation concerns.
Influence mechanism: Rate cuts will lower real interest rates and the US dollar exchange rate, significantly reducing the cost of holding gold. If subsequent CPI/PPI data are weak or the job market deteriorates, the rally may be triggered in advance.
2. Middle East geopolitical risks (pulse momentum)
Event escalation: The Israeli Defense Minister threatened to strike Iran again, and the risk of obstruction of Red Sea shipping increased.
Risk aversion logic: If the conflict breaks out in substance (such as an attack on oil facilities), it will trigger a safe-haven fund to flow into gold. At the same time, the surge in oil prices may push up global inflation and strengthen the anti-inflation properties of gold.
3. Trump's tariff policy (stagflation catalyst)
Policy impact: 50% tariff on Brazilian goods and imported copper (effective on August 1), triggering global supply chain disturbances.
Double effect: Pushing up the US dollar in the short term will suppress gold prices, but it may aggravate stagflation risks in the medium and long term, providing underlying support for gold.
Key contradiction conclusion:
The expectation of interest rate cuts is the cornerstone of gold's trend rise, and geopolitical and tariff risks provide breakthrough momentum. If the three resonate (such as escalation of conflicts + September interest rate cuts + tariffs push up inflation), gold prices may quickly hit above $3,400.
Technical multi-cycle analysis
Daily level
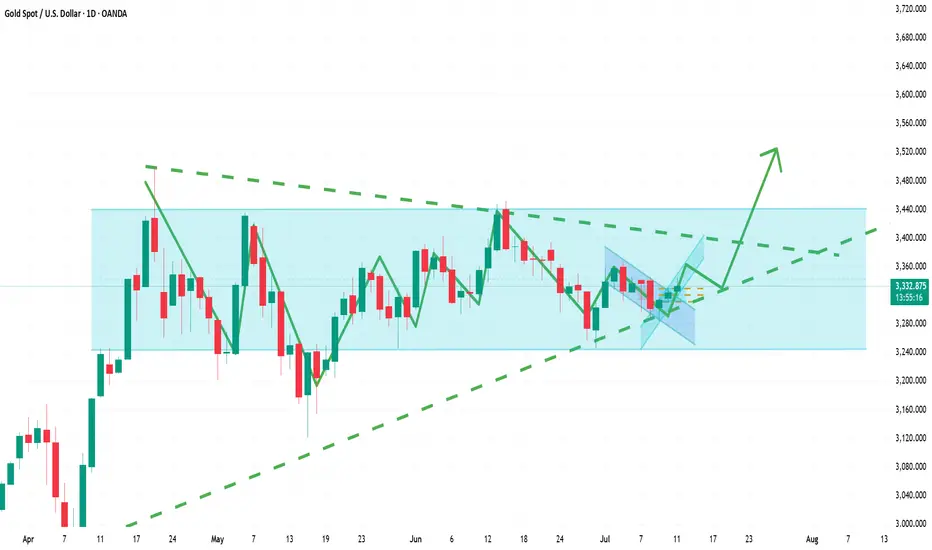
Pattern structure: Gold has fallen from the April high of $3,500, forming a triangular convergence pattern. After breaking through the previous high resistance of $3,346 and standing firm, it will enter the $3,350-3,374 oscillation box. MACD shows a golden cross signal, and RSI stands firm in the neutral zone of 55, indicating that bulls are accumulating power.
Key watershed:
Upward breakthrough point: $3374 (0.618 Fibonacci retracement level + previous daily high), after stabilization, it will open up the 3400-3420 space.
Downward risk point: $3330 (10-day moving average + triangle upper rail), if it fails, it may drop to 3310-3280 support.
Short cycle (4H/1H)
4-hour chart: The price runs in the rising channel (lower edge 3340/upper edge 3372), and the narrowing of the Bollinger Bands indicates that a breakthrough is imminent. Pay attention to the $3345 moving average support, and maintain the offensive if it holds.
1-hour chart: MACD top divergence repair is completed, and the high point of $3340 breaks through and stabilizes, which will trigger short-term follow-up buying.
Today's key events and trading windows
US June PPI annual rate: If the data is lower than the previous value of 2.2%, it will strengthen the logic of interest rate cuts and push up gold prices;
Federal Reserve Board member Waller's speech: Dovish remarks may become a catalyst for breaking through $3,346;
Israel Security Cabinet Meeting: Any signal of military action will trigger safe-haven buying.
Today's strategy
It is recommended to buy around 3,320, stop loss at 3,300. Target 3,340.
If my analysis can help you, I hope you can cheer me up.
At present, the long and short forces are in a tug-of-war between three key factors:
1. Expectations of Fed rate cuts (core support)
Latest developments: Fed Governor Waller strongly called for a rate cut in July, but the market expects a rate cut in September with a probability of over 70% (CME data). The chairman of the San Francisco Fed expressed support for two rate cuts this year to ease inflation concerns.
Influence mechanism: Rate cuts will lower real interest rates and the US dollar exchange rate, significantly reducing the cost of holding gold. If subsequent CPI/PPI data are weak or the job market deteriorates, the rally may be triggered in advance.
2. Middle East geopolitical risks (pulse momentum)
Event escalation: The Israeli Defense Minister threatened to strike Iran again, and the risk of obstruction of Red Sea shipping increased.
Risk aversion logic: If the conflict breaks out in substance (such as an attack on oil facilities), it will trigger a safe-haven fund to flow into gold. At the same time, the surge in oil prices may push up global inflation and strengthen the anti-inflation properties of gold.
3. Trump's tariff policy (stagflation catalyst)
Policy impact: 50% tariff on Brazilian goods and imported copper (effective on August 1), triggering global supply chain disturbances.
Double effect: Pushing up the US dollar in the short term will suppress gold prices, but it may aggravate stagflation risks in the medium and long term, providing underlying support for gold.
Key contradiction conclusion:
The expectation of interest rate cuts is the cornerstone of gold's trend rise, and geopolitical and tariff risks provide breakthrough momentum. If the three resonate (such as escalation of conflicts + September interest rate cuts + tariffs push up inflation), gold prices may quickly hit above $3,400.
Technical multi-cycle analysis
Daily level
Pattern structure: Gold has fallen from the April high of $3,500, forming a triangular convergence pattern. After breaking through the previous high resistance of $3,346 and standing firm, it will enter the $3,350-3,374 oscillation box. MACD shows a golden cross signal, and RSI stands firm in the neutral zone of 55, indicating that bulls are accumulating power.
Key watershed:
Upward breakthrough point: $3374 (0.618 Fibonacci retracement level + previous daily high), after stabilization, it will open up the 3400-3420 space.
Downward risk point: $3330 (10-day moving average + triangle upper rail), if it fails, it may drop to 3310-3280 support.
Short cycle (4H/1H)
4-hour chart: The price runs in the rising channel (lower edge 3340/upper edge 3372), and the narrowing of the Bollinger Bands indicates that a breakthrough is imminent. Pay attention to the $3345 moving average support, and maintain the offensive if it holds.
1-hour chart: MACD top divergence repair is completed, and the high point of $3340 breaks through and stabilizes, which will trigger short-term follow-up buying.
Today's key events and trading windows
US June PPI annual rate: If the data is lower than the previous value of 2.2%, it will strengthen the logic of interest rate cuts and push up gold prices;
Federal Reserve Board member Waller's speech: Dovish remarks may become a catalyst for breaking through $3,346;
Israel Security Cabinet Meeting: Any signal of military action will trigger safe-haven buying.
Today's strategy
It is recommended to buy around 3,320, stop loss at 3,300. Target 3,340.
If my analysis can help you, I hope you can cheer me up.
❤️I am a trading researcher focusing on the gold field.
❤️If you are looking for direction, welcome to follow me.
👉t.me/+CW0VWaiEB59hMmJh
❤️If you are looking for direction, welcome to follow me.
👉t.me/+CW0VWaiEB59hMmJh
Disclaimer
The information and publications are not meant to be, and do not constitute, financial, investment, trading, or other types of advice or recommendations supplied or endorsed by TradingView. Read more in the Terms of Use.