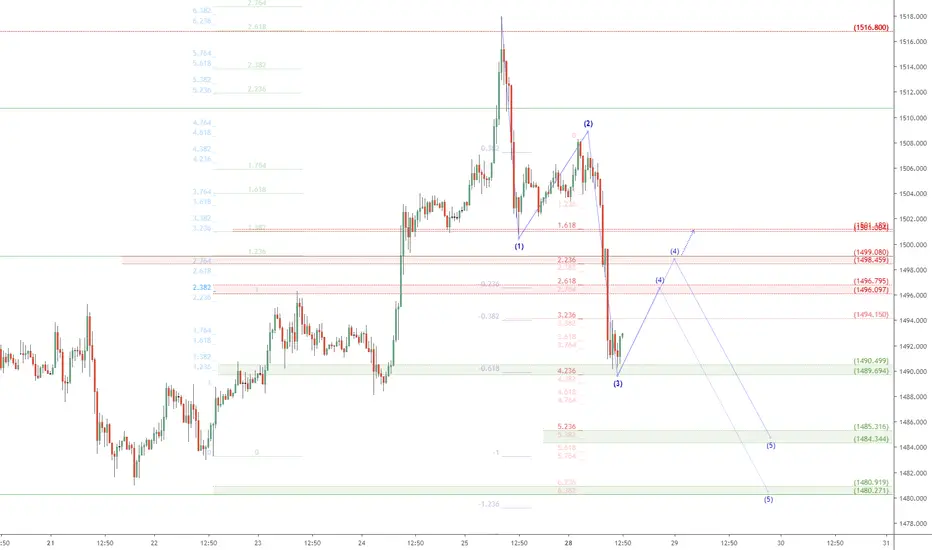
Gold had a "Blow off Top" just above serious resistance.
Then came the requisite fast drop to trap bulls up above.
Now approaching some support zones for possible bounce.
The velocity of this drop indicates another leg down is likely.
But it is possible that correction is DONE (abc instead of 123).
So a long scalp from here towards the 1500 is worth considering.
The EW waves plotted are GUESSES, but the Zones are SOLID.
Expect a reaction at each zone, and observe closely for clues.
And of course, be wary of Trump tweets or other news chaos.
Previous Gold Analysis (click):
$1516 Top Call
$1498 top call
$1650 then $2100?<= Still Plausible
$1480 short TP
$1515 top call<= Awesome Short
$1555 top call<= Just in Time
$1406 to $1525<= Caught the Jump
$1386 bounce
$1439 top call<= To the Penny
$1332 bounce
$1270 bounce<= To the Penny
$1280 break
$1380 call <= 9 mos ago
Of course, I have had total FAILS on some ideas too, not going to pretend.
But all of my plots show PRECISE entries, TIGHT stops, and EXACT targets.
Precision is the way of the Fib. Almost every turn happens at a Fib Line.
Note
Bounce did not make it to the plotted targets but I was afraid of that when the line at 1494.150 started acting as strong resistance Zooming in and extending the fib lines from Red fib of last drop, we see the 5.618 was the key
Zooming in some more and looking at the bounce
.
Note
slammed into the 2.236 and even pierced it wee bit Thus all these fib lines are still valid, so if it drops below the 2.236, I will look at the 1.618 for strong bounce.
.
Note
wow, our little bounce is hinting of the 2.236 having been bottom .
Note
Nice Rhythm. Bulls held the 2.236 as mentioned, and now they are trying to establish the 3.236 as new support .
Note
Bulls unable to hold the 3.236, and the price action proves the theory that "each time a support is hit, it gets weaker" .
Note
I have posted a separate Idea to observe behavior around a very important fib series which indicates likely end of wave 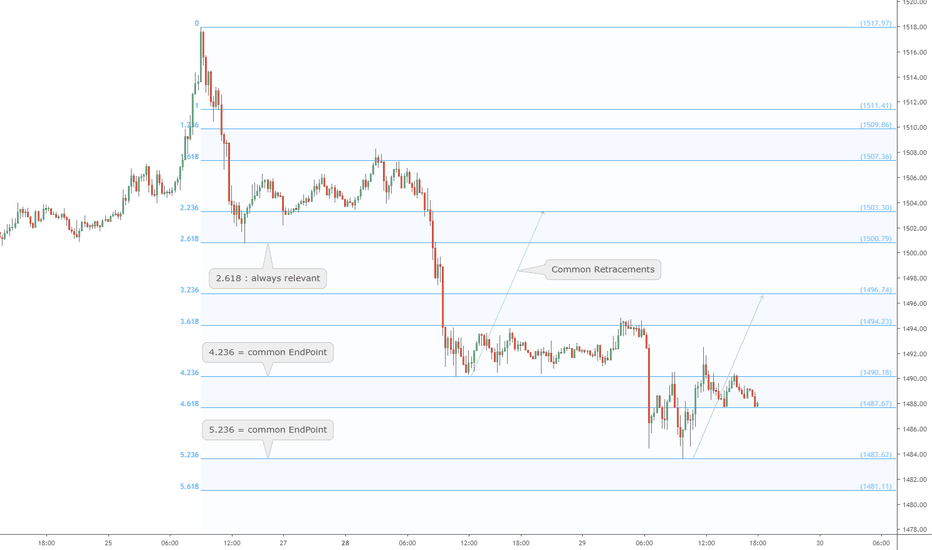
.
the Golden Ratio is my Religion
the Trading View is my Nation
the Moderator Tag is my Flag
the Trading View is my Nation
the Moderator Tag is my Flag
Related publications
Disclaimer
The information and publications are not meant to be, and do not constitute, financial, investment, trading, or other types of advice or recommendations supplied or endorsed by TradingView. Read more in the Terms of Use.