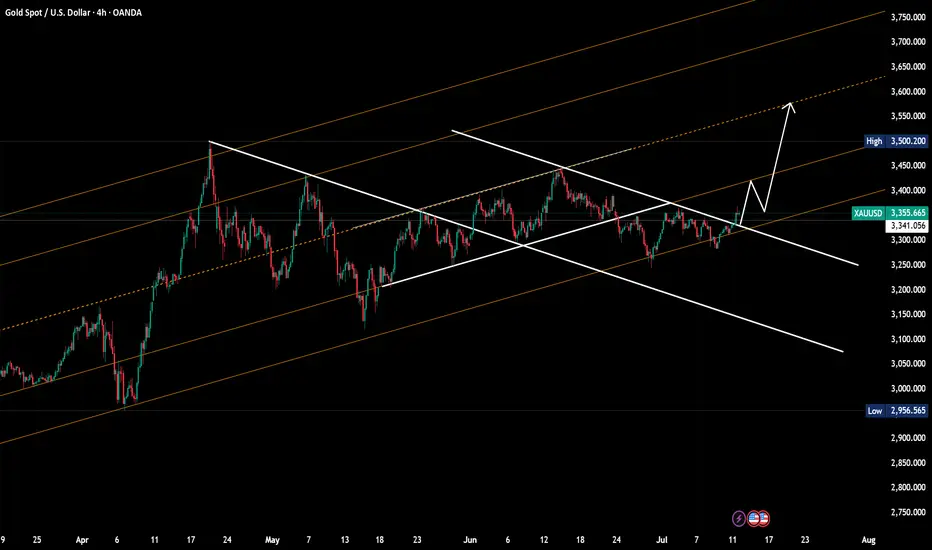
Gold Weekly Report Conclusion: Continue to be bullish
I. Market Review This Week
Under pressure in the first half of the week: Affected by the strengthening of the US dollar, the gold price once fell below 3,300 points.
Rebound in the second half of the week: As the Trump administration announced new tariffs on Canada, market risk aversion increased, and the gold price rebounded to above 3,350 points and finally closed at 3,355 points.
Review of key influencing factors:
Federal Reserve policy expectations: The market still expects a possible rate cut in September, but some officials expressed hawkish views, resulting in short-term fluctuations in gold prices.
Geopolitical risks: US-Canada trade frictions and tensions in the Middle East support safe-haven demand.
Central bank gold purchases: The People's Bank of China has increased its gold holdings for eight consecutive months, and the global central bank's gold purchase trend has not changed.
II. Analysis of gold trend next week
1. Fundamental outlook
(1) Federal Reserve policy and US dollar trend
Next week, focus on the speech of Federal Reserve Chairman Powell (July 16) and US June retail sales data (July 17).
If retail data is weak, it may strengthen expectations of a rate cut in September, which is good for gold. On the contrary, if the data is strong, the US dollar may rebound, suppressing gold prices. The US dollar index (DXY) is currently around 104.5. If it falls below 104, gold may rise further. (2) Geopolitical risks: US-Canada trade friction: If the conflict escalates, safe-haven buying may continue to support gold prices. Middle East situation: Progress in Iran nuclear negotiations and Red Sea shipping safety are still potential catalysts. (3) Central bank gold purchases and institutional holdings: The global central bank's gold purchase trend has not changed. China, Poland and other countries are still increasing their holdings, which will support gold prices in the long term. ETF holdings: SPDR Gold ETF holdings increased by 5.3 tons last week, indicating that market sentiment has warmed up. Technical analysis: (1) Short-term trend (daily chart) Key support levels: 3300 (psychological support level), 3277 (trend line support level). Key resistance levels: 3373 (61.8% Fibonacci retracement level), 3400 (psychological barrier).
Moving average system: 50-day moving average (3330) provides support.
If it stands at 3350 points, it may challenge 3400 points.
MACD indicator: The fast and slow lines form a golden cross, the momentum column turns strong, and the short-term trend is bullish.
(2) Medium-term trend (weekly chart)
The rising channel is maintained, and the long-term trend is still bullish.
Key resistance: 3452 (previous high point), which may open up upward space after breaking through.
Key support: 3247 (61.8% retracement level), if it falls below, it may enter a macro adjustment.
III. Trading strategy for next week
1. Bullish scenario (breakthrough 3373 points)
Entry conditions: Stand firm at 3373 points, and the US dollar weakens.
Target: 3400→3452.
Stop loss: below 3340.
2. Bearish scenario (falling below 3300)
Entry conditions: falling below 3300 and the US dollar rebounding.
Target: 3277→3247.
Stop loss: above 3320.
3. Oscillating strategy (3300-3373 range)
Buy low and sell high, pay attention to the competition around 3350.
Conclusion
Short term (next week): Gold prices may fluctuate in the range of 3300-3373, pay attention to the speech of the Federal Reserve and retail data.
Breakout direction: If it stands at 3350, it is expected to test 3400; if it falls below 3300, it may fall to 3277.
Free Signals:
t.me/+Hy1szYIVKdkzNzM0
Choice is more important than effort
t.me/+Hy1szYIVKdkzNzM0
Choice is more important than effort
Disclaimer
The information and publications are not meant to be, and do not constitute, financial, investment, trading, or other types of advice or recommendations supplied or endorsed by TradingView. Read more in the Terms of Use.