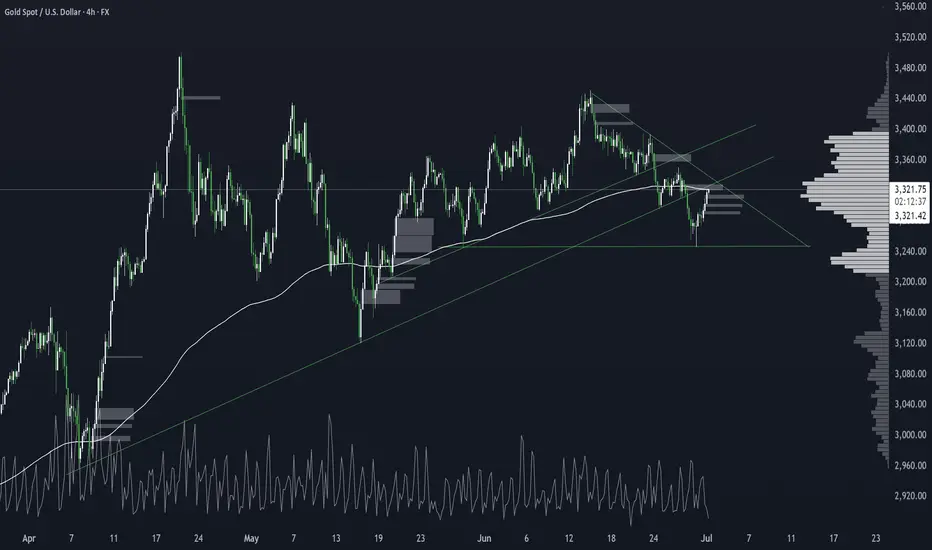
🔷 Chart Structure & Trendlines
Since early June, gold has formed a clean descending channel on the 4‑hour chart. Each bounce and rejection has respected these channel edges, which reflect consistent lower highs and lower lows.
A long-term ascending trendline (from late March lows) was recently broken. This broken support has now flipped into resistance, and price is currently retesting it.
The intersection of the descending channel’s top, the trendline resistance, and the 200 EMA creates a major triple-confluence zone—a classic area of institutional interest.
🔷200 EMA
The 200 EMA on the 4H chart is acting as dynamic overhead resistance, which price is currently testing.
Historically, during bearish regime, retests of the 200 EMA from below often trigger strong rejections.
If price breaks above and holds, it would mark a significant shift in market sentiment. If rejected, it adds weight to the bearish trend.
🔷Fair Value Gap (FVG) & Supply Order Blocks
A Fair Value Gap (vicinity of $3,340–3,350) remains structurally unfilled from the previous breakdown.
Price is now re-entering that FVG region—an area often used by smart money to target liquidity and trap retail traders.
This is a logical zone for sell orders, as price frequently reacts where gaps exist.
🔷Volume Profile: High/Low Volume Nodes
A High-Volume Node (HVN) sits around $3,360, where most sustained trading has occurred. This acts as a strong resistance/distribution area.
The current zone ($3,330–3,340) is a low-volume pocket, meaning moves through here can be fast, but rejections are still frequently seen.
Below, there's another HVN around $3,280–3,290—a logical demand area and intermediate target for retracement.
🔷Fundamental Perspective – This Week to Friday
🔸 U.S. Fed Outlook & Dollar Dynamics
U.S. dollar is weak, with growing speculation on imminent Fed rate cuts, partly due to pressure from political sources
Fed remains cautious—no July cut likely, more probable in September
Persistent volatility in Fed messaging means gold remains in play as a hedge.
🔸 Geopolitical & Macro Drivers
Geopolitical tensions (Middle East, trade) continue to add safe-haven support
Central banks, especially Australia, are upping gold purchases—may add structural support
🔸 Market Sentiment & Investment Flows
ETF inflows remain robust—global central bank demand offsetting retail weakness
Some macro research houses expect sideways action into early July, with range likely between $3,200–3,350
🔸 Risks Ahead of Friday
Watch for U.S. jobs data, Fed speakers, and geopolitical headlines—any surprise could spark sharp moves.
If Fed hints at delays in rate cuts or geopolitical risk cools, gold could see a rapid reactive drop.
🔷🤔 Possible Scenarios into Friday
✅ Bearish Rejection
Price fails to clear $3,340–$3,360 zone.
A strong rejection candle retests $3,280–$3,290.
Could accelerate down to $3,240 if momentum picks up.
⚠️ Bullish Breakout
Clean, high-volume break above 200 EMA and $3,360 HVN.
Likely continuation to $3,380–3,400, especially if supported by fundamentals (e.g., inflation, Fed dovish pivot).
🔷My Personal Bias into Friday
Slight bearish lean due to triple resistance confluence.
Fundamentals are mixed: Fed caution supports gold structurally but no immediate catalyst.
I will monitor price action closely: a sharp rejection off the 200 EMA area would confirm suspicion; but a clean breakout would require reassessment.
Disclaimer
The information and publications are not meant to be, and do not constitute, financial, investment, trading, or other types of advice or recommendations supplied or endorsed by TradingView. Read more in the Terms of Use.
Disclaimer
The information and publications are not meant to be, and do not constitute, financial, investment, trading, or other types of advice or recommendations supplied or endorsed by TradingView. Read more in the Terms of Use.