Greetings traders this is my analysis on XAUUSD and it is Long
🧠 Technical Breakdown:
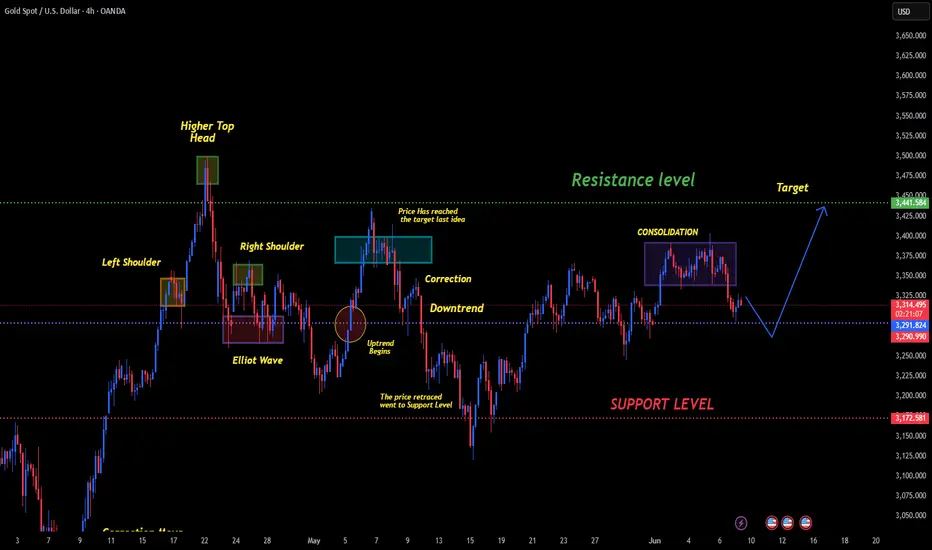
Head & Shoulders Formation:
A clear Head and Shoulders pattern is visible, with:
Left Shoulder forming around April 14–15,
Head peaking on April 18–19,
Right Shoulder forming April 23–24.
This is a classic bearish reversal pattern, which played out as expected.
Elliot Wave Structure:
An Elliot Wave impulse followed by a corrective wave appeared right after the head formation.
The market then entered a downtrend, completing a retracement toward the support zone (3172).
Previous Idea Target Hit:
The price reached the previous target area, confirming the validity of earlier projections (noted in blue rectangle on May 7).
Current Market Structure:
After bouncing from support, the market entered a consolidation phase (early June), signaling indecision.
A short-term dip toward the minor support at 3290 is possible before a projected bullish move.
🔮 Forecast:
Expect a short-term pullback to the support zone around 3290.
If buyers step in at that level, we could see a bullish continuation toward the resistance/target level of 3441.
Confirmation will depend on how price reacts at the minor support and if a breakout from consolidation occurs.
🛠️ Key Levels to Watch:
Support Levels:
🔴 3172 (Major)
🔵 3290 (Minor – Potential bounce zone)
Resistance/Target:
🟢 3441 (Target from consolidation breakout)
✅ Trade Plan (Not Financial Advice):
Bullish Scenario: Look for bullish reversal candlesticks at 3290 for long entries.
Bearish Scenario: A break below 3290 invalidates the idea — watch for potential retest of 3172.
Dear Traders like,comment let me know what do you think?
🧠 Technical Breakdown:
Head & Shoulders Formation:
A clear Head and Shoulders pattern is visible, with:
Left Shoulder forming around April 14–15,
Head peaking on April 18–19,
Right Shoulder forming April 23–24.
This is a classic bearish reversal pattern, which played out as expected.
Elliot Wave Structure:
An Elliot Wave impulse followed by a corrective wave appeared right after the head formation.
The market then entered a downtrend, completing a retracement toward the support zone (3172).
Previous Idea Target Hit:
The price reached the previous target area, confirming the validity of earlier projections (noted in blue rectangle on May 7).
Current Market Structure:
After bouncing from support, the market entered a consolidation phase (early June), signaling indecision.
A short-term dip toward the minor support at 3290 is possible before a projected bullish move.
🔮 Forecast:
Expect a short-term pullback to the support zone around 3290.
If buyers step in at that level, we could see a bullish continuation toward the resistance/target level of 3441.
Confirmation will depend on how price reacts at the minor support and if a breakout from consolidation occurs.
🛠️ Key Levels to Watch:
Support Levels:
🔴 3172 (Major)
🔵 3290 (Minor – Potential bounce zone)
Resistance/Target:
🟢 3441 (Target from consolidation breakout)
✅ Trade Plan (Not Financial Advice):
Bullish Scenario: Look for bullish reversal candlesticks at 3290 for long entries.
Bearish Scenario: A break below 3290 invalidates the idea — watch for potential retest of 3172.
Dear Traders like,comment let me know what do you think?
Trade closed: target reached
Disclaimer
The information and publications are not meant to be, and do not constitute, financial, investment, trading, or other types of advice or recommendations supplied or endorsed by TradingView. Read more in the Terms of Use.
Disclaimer
The information and publications are not meant to be, and do not constitute, financial, investment, trading, or other types of advice or recommendations supplied or endorsed by TradingView. Read more in the Terms of Use.