Market background review
Risk aversion cools down: Due to the impact of Trump-related news, the safe-haven demand for gold has weakened, resulting in a high and fall on Monday (May 26), and continued weakness in the Asian and European sessions.
Impact of the US market closure: Due to the Memorial Day holiday in the United States, market liquidity is low, market volatility is limited, and the overall trend is volatile and downward.
Key technical analysis
1. 4-hour level trend
Bollinger band structure: Gold prices fell after touching the upper track of the Bollinger band (near 3365), and are currently seeking support near the middle track (3320-3323), which is also the starting point of last Friday's rise.
Moving average system:
MA5 crosses MA10, showing a short-term adjustment signal.
Long-term moving averages (such as MA60) are still higher than medium-term moving averages, indicating that the general trend has not completely turned to bearish, but there is still a need for a short-term correction.
RSI indicator: Falling back from the overbought area to near the middle line (3357 corresponding price), suggesting that there is still room for decline.
2. Key price structure
Resistance:
3342 (Monday's rebound high)
3350 (psychological barrier)
3365 (double top pressure, strong resistance)
Support:
3320-3323 (4-hour Bollinger middle rail + last Friday's starting point)
3300-3305 (key integer barrier, if it falls below, it may accelerate downward)
3. Short-term trend judgment
Two attacks on 3365 failed, and Monday opened lower, indicating that the bulls lack momentum and the short-term trend is oscillating downward.
The 1-hour chart forms a descending channel. If it falls below 3320, it may further test the 3300 support.
If it rebounds to the 3342-3350 area under pressure, it is still a short-selling opportunity.
Today's trading strategy
1. Short-order opportunity (main strategy)
Entry point: 3342-3350 range, arrange short orders in batches
Stop loss: above 3355 (to prevent false breakthroughs)
Target: 3320 (first target), look at 3305-3300 after breaking
2. Long-order opportunity (auxiliary strategy)
Entry conditions: first touch 3300-3305 without breaking, you can try long with a light position
Stop loss: below 3295 (to prevent the break from accelerating the decline)
Target: 3320-3325 (short-term rebound)
3. Key risk warning
If the gold price stands above 3350, it may test 3365 again, and short orders should be cautious.
If it falls below 3300, it may further test the support of 3280-3270, and attention should be paid to changes in market sentiment.
Summary and Operational Suggestions
✅ Main idea: short sell when the price rebounds to 3342-3350, target 3320-3300.
✅ Secondary idea: short-term long sell when the price stabilizes near 3300, quick in and quick out.
⚠️ Note: Pay attention to the changes in market liquidity after the resumption of trading in the US market today, and avoid heavy positions before major data.
(The above analysis is based on the current technical structure, and specific transactions need to be flexibly adjusted in combination with the real-time market.)
Trade active
After the continuous rise last week, the gold price was suppressed at the beginning of this week, and the gold price encountered resistance and began to adjust. The main reason was that last weekend, US President Trump said that the date of imposing 50% tariffs on the EU was agreed to be postponed from June 1 to July 9, and the EU's chief trade negotiator said on Monday that the EU was fully committed to reaching a trade agreement before the July 9 deadline, which eased the market's concerns about trade uncertainty and the US dollar rebounded from a one-month low. Although the gold rally was blocked, concerns about the US fiscal deficit, economic prospects and geopolitical tensions still attracted safe-haven buying, which supported the gold trend.
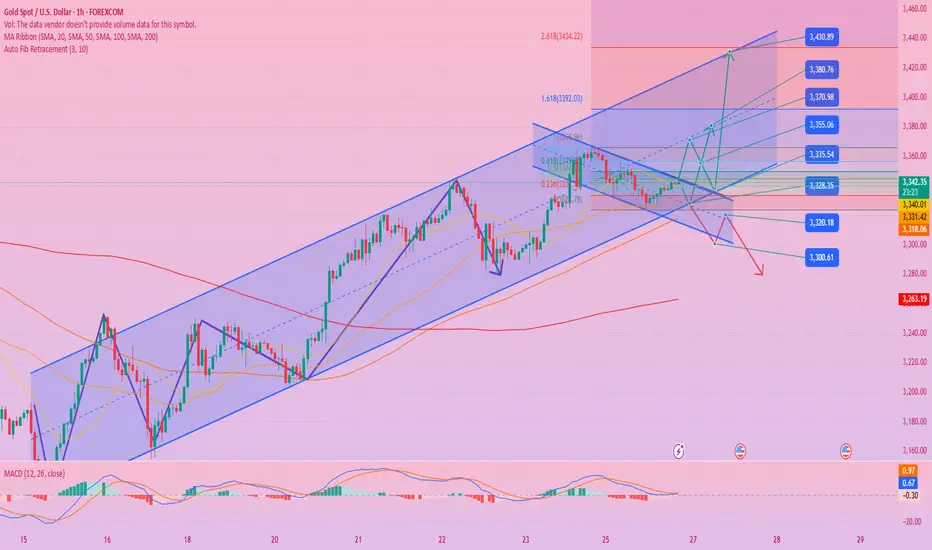
The key resistance level of gold's rise this time is around $3365-3370, which we emphasized in our weekly review last week. This is the previous top and bottom conversion level, and it is also around the golden section rebound of 764. This week, gold opened with a gap down, and the rebound high was around 3355, showing a weak rise. Gold is expected to further expand adjustments in the short term.
On the daily chart, the gold rally was blocked this week and the short-term shock adjustment was carried out. For the upper pressure of gold, pay attention to the low point of gold price falling back to $3323 on Monday, which is also the current 5-day moving average position of the daily line, followed by the intraday high point of gold price rebound at $3350; for the lower support of gold, pay attention to the middle track of the daily Bollinger band at $3288, which is also near the intraday low. After gold broke upward last week, the middle track of the daily Bollinger band became the main support position for the rebound of gold prices. Losing this position will increase the risk of short-term decline. Pay attention to the upward breakthrough position of gold prices last week at $3250.
The 1-hour chart shows: the Bollinger band has completed its opening, and the gold price has plummeted. It is currently hovering around the $3290mark. The short-term rebound resistance is around the MA moving average of $3,320. If it breaks above, we will look at the resistance near $3,330 on the SAR indicator. If the rebound is under pressure, it is not ruled out that the gold price will fall and touch around 3280 and 3250;
Trade closed: target reached
Analysis of the latest trend of gold
Last week, gold has risen by 3% cumulatively, and is expected to record the best single-week performance since early April. The current gold market shows a cautious and optimistic sentiment. On the one hand, fundamental positive factors continue to accumulate, including escalating geopolitical risks, intensified US fiscal concerns, and support from monetary policy expectations. These factors maintain the market's bullish sentiment basis.
2025 is a strong year for gold. The risk aversion of gold cannot be seen from a single factor, such as changes in the geopolitical situation, the unsuccessful negotiations between Russia and Ukraine, the Federal Reserve's interest rate decision, the decline in US debt confidence, and the increase in global central bank purchases. Gold will still go out of the upside as a strong risk aversion tool. Therefore, as long as the overall environment remains unchanged, it is difficult for gold to have a large short or a large downside in the short term.
After stabilizing at 3285 on Tuesday, the gains and losses of 3315 during the day are the key to the subsequent layout. The current price pattern is similar to the Asian morning market last Friday, and it once again tested the 3315 position, but it fell back after a high rise. The Asian morning market did not stand at 3315, which means that the short-term retracement and decline have not ended, and only a breakthrough of 3325 will have a chance to continue upward. So first treat it around the pressure and temporarily focus on the range of 3325 to 3280.
Gold is not so strong at the 4-hour level. The market encountered resistance and fell back at the upper track. Now the market has fallen and touched the lower track. The Bollinger Bands are not open and are flat, indicating that the market is in a short-term volatile trend. The lower support of 3280 just coincides with the lower track. The upper side focuses on the resistance near the middle track of 3325. If the pressure near the middle track of 3325 is broken, it can be seen to the upper track of 3365. If the market breaks below 3280, the market will weaken. At that time, it will be seen around 3250-3230. Intraday trading, 3280 is used as defense to see a rebound. The rise will gradually see 3325. If 3325 breaks strongly, do not short.
Investment strategy: Gold 3325 short, stop loss 3335, target 3250
Related publications
Disclaimer
The information and publications are not meant to be, and do not constitute, financial, investment, trading, or other types of advice or recommendations supplied or endorsed by TradingView. Read more in the Terms of Use.
Related publications
Disclaimer
The information and publications are not meant to be, and do not constitute, financial, investment, trading, or other types of advice or recommendations supplied or endorsed by TradingView. Read more in the Terms of Use.