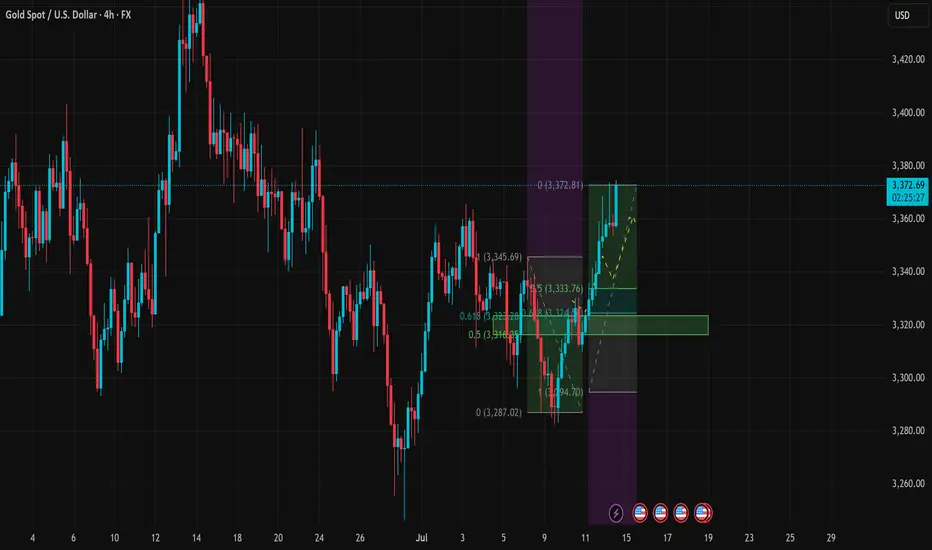
Gold (XAUUSD) is currently trading around $3,373, rebounding strongly from the recent low at $3,294. Price is now testing the key resistance zone at $3,372–3,375, which aligns with the 0.0 Fibonacci retracement of the previous downtrend and a significant supply zone on the H4 timeframe.

1. Technical Analysis (H4 Chart):
🔹 Fibonacci & Price Action:
The price found strong support at $3,294, where previous demand and Fibonacci levels converge.
A sharp bullish move has pushed price above the 0.5 (at $3,316) and 0.618 (at $3,322) Fibonacci levels – signaling strong buyer interest.
The $3,372 zone is now acting as short-term resistance, matching the previous swing high.
🔹 EMA & RSI:
EMAs are trending upward, confirming short-term bullish momentum.
RSI is approaching overbought territory, suggesting a potential pullback in the short term.
🔹 Trendline & Structure:
Price remains above the rising trendline, indicating sustained bullish momentum.
The nearest support zone is now at $3,322 – $3,333, which overlaps with key Fibonacci and previous structure levels.
2. Key Price Levels:
Price Zone
Significance:3,372 – 3,375
Short-term resistance – Fibo 0.0:3,345 – 3,333
First support – pullback zone:3,322 – 3,316
Strong support – EMA + Fibo 0.5:3,294 – 3,287
Major support – recent swing low
3. Suggested Trading Strategies:
Strategy 1 – Take Profit for Existing Longs:
If you entered long positions near $3,295–$3,300, consider taking partial profits at the current resistance zone ($3,372–$3,375).
Strategy 2 – Short-Term Sell Opportunity:
Consider a short entry near $3,372–$3,375, with a stop-loss above $3,383.
Target profit: $3,333 – $3,322
Strategy 3 – Buy on Dip (Trend Continuation):
If price pulls back to the $3,333 – $3,322 support and holds, this is a good zone to enter long.
Stop-loss below $3,316, with potential target back to $3,385 – $3,400 if a breakout occurs.
Gold is showing a solid recovery after a sharp decline, but it is now testing a key resistance zone around $3,373. Caution is advised in the short term, as a pullback may occur. Priority should be given to "Buy on Dip" strategies if support zones hold.
🪙 JOIN OUR FREE TELEGRAM GROUP 🪙
t.me/dnaprofits
Join the community group to get support and share knowledge!
️🥇 Exchange and learn market knowledge
️🥇 Support free trading signals
t.me/dnaprofits
Join the community group to get support and share knowledge!
️🥇 Exchange and learn market knowledge
️🥇 Support free trading signals
Related publications
Disclaimer
The information and publications are not meant to be, and do not constitute, financial, investment, trading, or other types of advice or recommendations supplied or endorsed by TradingView. Read more in the Terms of Use.