🟩 Today’s GOLD Analysis based on Volume Behavior, Smart Money Traps & Market Structure (MMC)
🔍 Chart Breakdown and MMC Concepts Explained:
1. Preceding Downtrend – Smart Money Trap Initiated
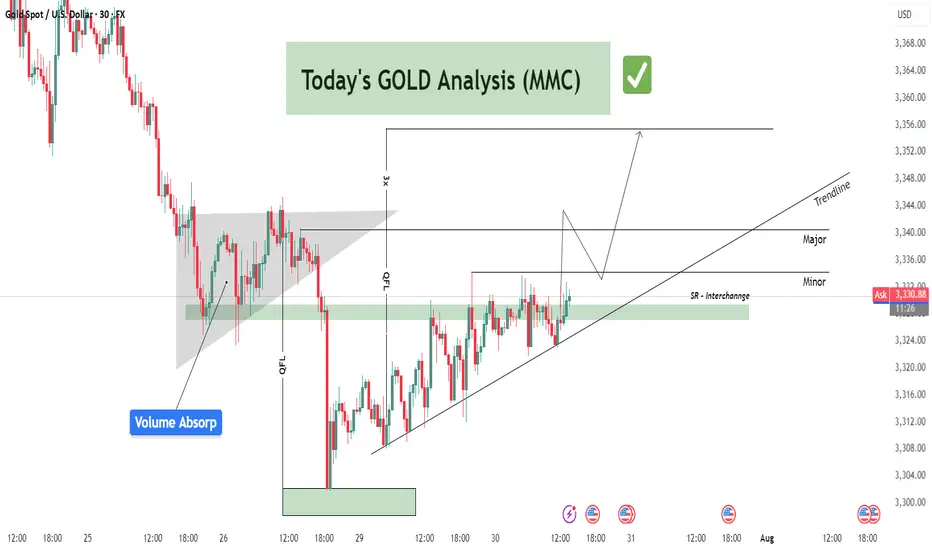
The chart begins with an extended downtrend, marking significant bearish pressure. However, deeper into the move, we notice price entering a Volume Absorption (VA) Zone — a key MMC signal where institutional orders quietly absorb aggressive retail selling.
This Volume Absorption Zone is highlighted on the left of the chart.
Smart money quietly positions longs here while inducing panic-selling from retail traders.
Wicks and indecision candles show early signs of sell exhaustion.
2. QFL Breakdown & Liquidity Sweep
The breakdown from the QFL (Quick Flip Level) is another hallmark of MMC behavior. The market intentionally breaks previous lows to trigger stop-loss clusters — known as a liquidity sweep or stop-hunt.
Price aggressively drops to a well-marked demand zone.
Massive bullish reaction from this zone confirms that smart money has completed accumulation.
The QFL move is not a true breakout, but a trap, designed to mislead retail into chasing shorts.
3. Demand Zone Reaction – Shift in Momentum
Price finds support at the demand zone (highlighted in green) and starts forming higher lows. This transition from lower lows to higher lows is a structural confirmation of market reversal.
Buyers have regained control.
Large bullish candles and wick rejections at key levels signal institutional entry.
4. SR Interchange Zone – Key MMC Confirmation
One of the most important zones on this chart is the SR Interchange area.
This level was previously resistance and is now acting as support — a concept known as support-resistance flip.
MMC teaches us that this is where smart money re-tests the breakout zone to trap late sellers and confirm the trend.
This zone is reinforced by:
Previous rejections
Retest with wicks
Alignment with ascending trendline support
5. Minor & Major Resistance Levels
Currently, price is attempting to break above a minor resistance at ~$3,330–3,332.
If it breaks, the next major target lies at the ~$3,340–3,345 level, marked on the chart.
This zone is crucial for short-term targets and may act as a profit-taking zone for early bulls.
Once this major resistance is cleared, the trendline projection suggests a continuation toward higher highs.
📐 Trendline Analysis
An ascending trendline is supporting price action. Each bounce off this line has led to higher lows — a clear sign of bullish intent.
Trendline + SR Interchange = Confluence zone
Traders should watch for bullish engulfing candles or strong wick rejections at this trendline area for re-entry or add-ons.
🧠 MMC Strategy Interpretation (Mirror Market Concepts)
This chart perfectly follows the MMC logic:
Trap retail sellers during the downtrend.
Absorb their volume at a key zone (Volume Absorp).
Sweep liquidity below QFL level.
Reverse structure with a shift to higher highs and higher lows.
Interchange SR zone to test buyers' strength.
Continue trend post-confirmation with breakout above resistance.
This is the classic "trap-to-trend" sequence smart money uses repeatedly in gold and other volatile markets.
✅ Trade Setup Summary:
Bias: Strongly Bullish (based on market structure shift)
Entry #1: Pullback into SR Interchange (ideal if price rejects 3,326–3,328)
Entry #2: Break and retest of Minor Resistance (3,332–3,334)
Targets:
TP1: 3,340 (Major Resistance)
TP2: 3,345–3,350 (Projection based on breakout path)
Invalidation: Clean break below trendline and demand zone (~3,318)
🧭 Final Words for Traders:
Gold is currently positioned at a critical junction where structure, volume, and institutional behavior all align. If you're following MMC strategies, this is a textbook scenario:
Trap ✅
Absorption ✅
Structure Shift ✅
Trendline Support ✅
SR Interchange ✅
Now, we wait for confirmation and execute with discipline.
🔍 Chart Breakdown and MMC Concepts Explained:
1. Preceding Downtrend – Smart Money Trap Initiated
The chart begins with an extended downtrend, marking significant bearish pressure. However, deeper into the move, we notice price entering a Volume Absorption (VA) Zone — a key MMC signal where institutional orders quietly absorb aggressive retail selling.
This Volume Absorption Zone is highlighted on the left of the chart.
Smart money quietly positions longs here while inducing panic-selling from retail traders.
Wicks and indecision candles show early signs of sell exhaustion.
2. QFL Breakdown & Liquidity Sweep
The breakdown from the QFL (Quick Flip Level) is another hallmark of MMC behavior. The market intentionally breaks previous lows to trigger stop-loss clusters — known as a liquidity sweep or stop-hunt.
Price aggressively drops to a well-marked demand zone.
Massive bullish reaction from this zone confirms that smart money has completed accumulation.
The QFL move is not a true breakout, but a trap, designed to mislead retail into chasing shorts.
3. Demand Zone Reaction – Shift in Momentum
Price finds support at the demand zone (highlighted in green) and starts forming higher lows. This transition from lower lows to higher lows is a structural confirmation of market reversal.
Buyers have regained control.
Large bullish candles and wick rejections at key levels signal institutional entry.
4. SR Interchange Zone – Key MMC Confirmation
One of the most important zones on this chart is the SR Interchange area.
This level was previously resistance and is now acting as support — a concept known as support-resistance flip.
MMC teaches us that this is where smart money re-tests the breakout zone to trap late sellers and confirm the trend.
This zone is reinforced by:
Previous rejections
Retest with wicks
Alignment with ascending trendline support
5. Minor & Major Resistance Levels
Currently, price is attempting to break above a minor resistance at ~$3,330–3,332.
If it breaks, the next major target lies at the ~$3,340–3,345 level, marked on the chart.
This zone is crucial for short-term targets and may act as a profit-taking zone for early bulls.
Once this major resistance is cleared, the trendline projection suggests a continuation toward higher highs.
📐 Trendline Analysis
An ascending trendline is supporting price action. Each bounce off this line has led to higher lows — a clear sign of bullish intent.
Trendline + SR Interchange = Confluence zone
Traders should watch for bullish engulfing candles or strong wick rejections at this trendline area for re-entry or add-ons.
🧠 MMC Strategy Interpretation (Mirror Market Concepts)
This chart perfectly follows the MMC logic:
Trap retail sellers during the downtrend.
Absorb their volume at a key zone (Volume Absorp).
Sweep liquidity below QFL level.
Reverse structure with a shift to higher highs and higher lows.
Interchange SR zone to test buyers' strength.
Continue trend post-confirmation with breakout above resistance.
This is the classic "trap-to-trend" sequence smart money uses repeatedly in gold and other volatile markets.
✅ Trade Setup Summary:
Bias: Strongly Bullish (based on market structure shift)
Entry #1: Pullback into SR Interchange (ideal if price rejects 3,326–3,328)
Entry #2: Break and retest of Minor Resistance (3,332–3,334)
Targets:
TP1: 3,340 (Major Resistance)
TP2: 3,345–3,350 (Projection based on breakout path)
Invalidation: Clean break below trendline and demand zone (~3,318)
🧭 Final Words for Traders:
Gold is currently positioned at a critical junction where structure, volume, and institutional behavior all align. If you're following MMC strategies, this is a textbook scenario:
Trap ✅
Absorption ✅
Structure Shift ✅
Trendline Support ✅
SR Interchange ✅
Now, we wait for confirmation and execute with discipline.
For Daily Trade Setups and Forecast: 📈 t.me/xauusdoptimizer
Premium Signals Fr33: 💯 t.me/xauusdoptimizer
🥰🥳🤩
Premium Signals Fr33: 💯 t.me/xauusdoptimizer
🥰🥳🤩
Related publications
Disclaimer
The information and publications are not meant to be, and do not constitute, financial, investment, trading, or other types of advice or recommendations supplied or endorsed by TradingView. Read more in the Terms of Use.