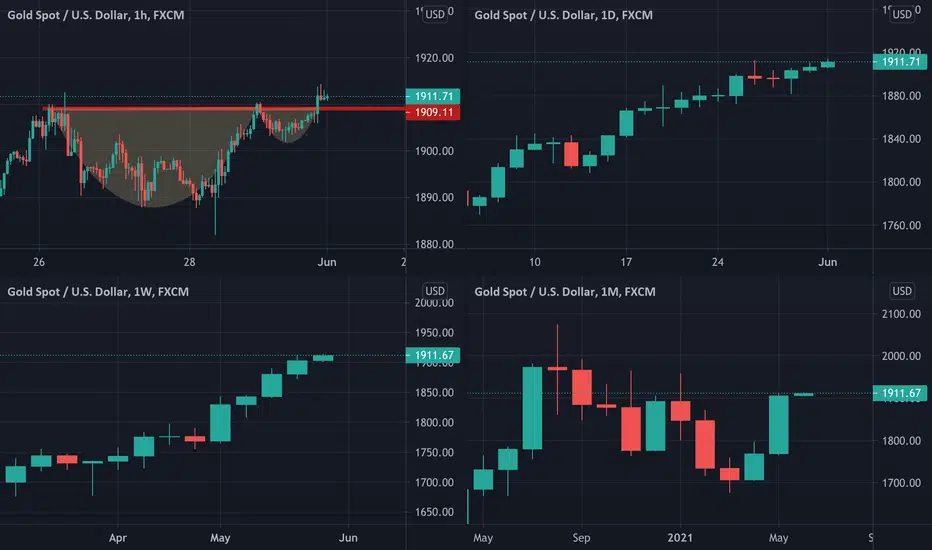
Multi-Timeframe Analysis:
Hourly Chart: cup and handle(Bullish)
Daily Chart: since May 5th, only one red candle with -1.19%, other two -0.11 and-.02%. No correction!!!
Weekly Chart: 11 out of last 13 candle green!
Monthly Chart: Maribozu candle with +7.79% gain in the last month.
Conclusion: I have never seen such a bullish trend in gold in the past 10 years..! Take it seriously..!
Use the following link to access trading ideas: patreon.com/SniperTraderStocks?utm_medium=unknown&utm_source=join_link&utm_campaign=creatorshare_creator&utm_content=copyLink
Disclaimer
The information and publications are not meant to be, and do not constitute, financial, investment, trading, or other types of advice or recommendations supplied or endorsed by TradingView. Read more in the Terms of Use.