XAUUSD August 8: Gold completes corrective structure – Buy opportunity on breakout
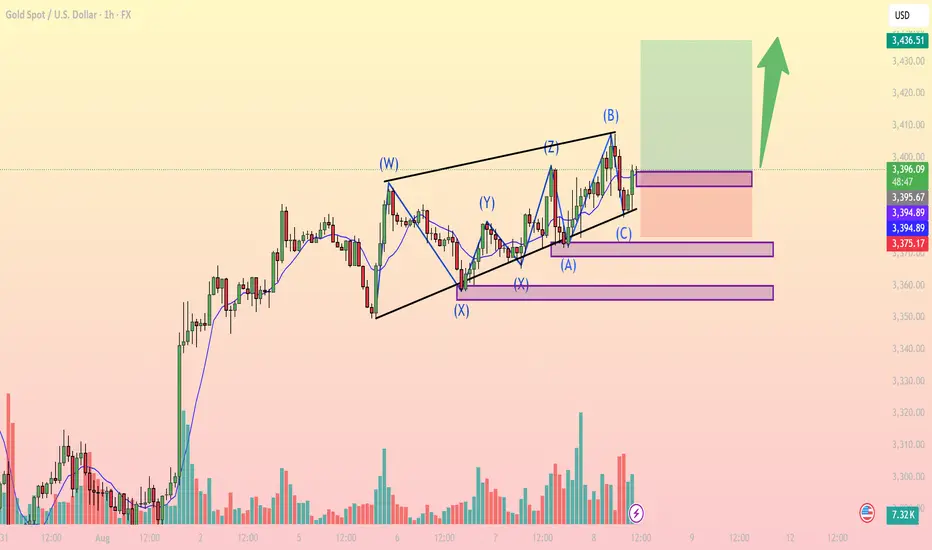
On the 1H chart, Gold (XAUUSD) has been consolidating within a complex WXYXZ corrective pattern following the strong bullish rally from August 1st. The recent (A)(B)(C) correction within wave Z appears to have completed, with price currently bouncing from a key demand zone around 3,394 – 3,395 USD.

Key bullish signals:
Corrective pattern completed: Wave (C) touched the lower trendline and showed a bullish reaction, suggesting end of the correction.
EMA bounce: Price is finding support from the short-term EMA, indicating a potential return of bullish momentum.
Rising volume: Especially after testing the 3,375 support zone, buying volume has increased, confirming accumulation.
Fibonacci confluence: The 3,394 level aligns with the 61.8% retracement of the previous bullish leg – a strong support zone for long entries.
Important price levels:
Immediate support: 3,394 – 3,395 (ideal buy zone).
Stronger support: 3,375 (stop-loss placement).
Resistance / Take Profit: 3,436 (previous high and supply zone).
Suggested Trading Strategy:
Bias: Long (Buy)
Entry: 3,395
Stop-loss: 3,375
Target: 3,436
Risk/Reward Ratio: ~1.99 – solid for an intraday setup.
Note: If price breaks below 3,375 with high volume, consider exiting early to avoid deeper downside toward 3,333.
Conclusion: Gold is likely resuming its uptrend after a complex corrective phase. This presents a potential long opportunity with a favorable risk/reward ratio if executed properly within the marked levels.
Follow for more high-quality trading setups – and don’t forget to save this idea if it fits your trading plan.
On the 1H chart, Gold (XAUUSD) has been consolidating within a complex WXYXZ corrective pattern following the strong bullish rally from August 1st. The recent (A)(B)(C) correction within wave Z appears to have completed, with price currently bouncing from a key demand zone around 3,394 – 3,395 USD.
Key bullish signals:
Corrective pattern completed: Wave (C) touched the lower trendline and showed a bullish reaction, suggesting end of the correction.
EMA bounce: Price is finding support from the short-term EMA, indicating a potential return of bullish momentum.
Rising volume: Especially after testing the 3,375 support zone, buying volume has increased, confirming accumulation.
Fibonacci confluence: The 3,394 level aligns with the 61.8% retracement of the previous bullish leg – a strong support zone for long entries.
Important price levels:
Immediate support: 3,394 – 3,395 (ideal buy zone).
Stronger support: 3,375 (stop-loss placement).
Resistance / Take Profit: 3,436 (previous high and supply zone).
Suggested Trading Strategy:
Bias: Long (Buy)
Entry: 3,395
Stop-loss: 3,375
Target: 3,436
Risk/Reward Ratio: ~1.99 – solid for an intraday setup.
Note: If price breaks below 3,375 with high volume, consider exiting early to avoid deeper downside toward 3,333.
Conclusion: Gold is likely resuming its uptrend after a complex corrective phase. This presents a potential long opportunity with a favorable risk/reward ratio if executed properly within the marked levels.
Follow for more high-quality trading setups – and don’t forget to save this idea if it fits your trading plan.
🪙 JOIN OUR FREE TELEGRAM GROUP 🪙
t.me/dnaprofits
Join the community group to get support and share knowledge!
️🥇 Exchange and learn market knowledge
️🥇 Support free trading signals
t.me/dnaprofits
Join the community group to get support and share knowledge!
️🥇 Exchange and learn market knowledge
️🥇 Support free trading signals
Related publications
Disclaimer
The information and publications are not meant to be, and do not constitute, financial, investment, trading, or other types of advice or recommendations supplied or endorsed by TradingView. Read more in the Terms of Use.