In the weekly time frame, a triangle pattern is formed, and the break of this triangle upwards indicates a price jump of up to $ 2100.

In the 1-day timeframe, a triangle with bold blue is broken

In the 4-hour time frame, there is an ascending channel with the current price in the middle of this channel. The price can reach the bottom of the canal and then make an upward movement to the canal ceiling

In the 1-hour timeframe, the ascending triangle ceiling marked in white is broken once and returned to the inside of the triangle. So he can break this white line upwards once again

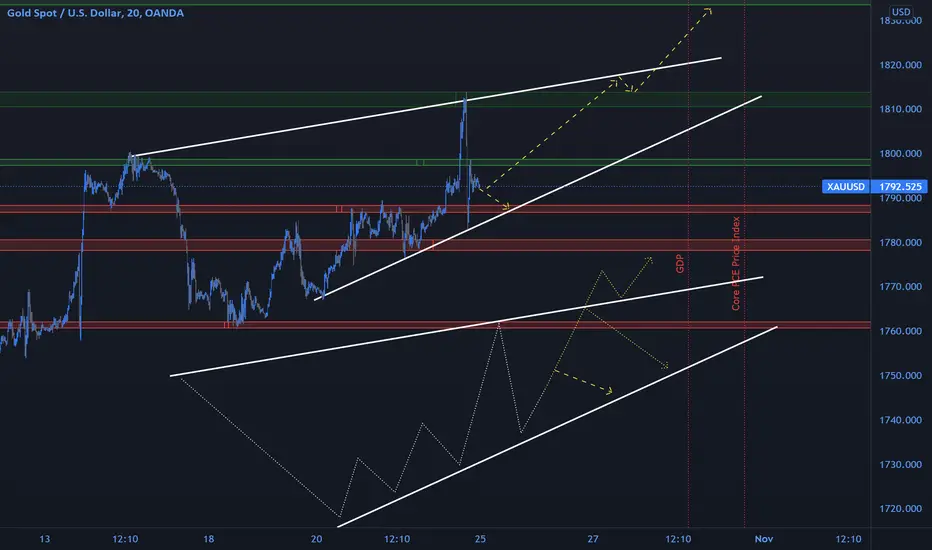
In the 20 minute time frame, we also have a triangular pattern that is formed from the two points of the previous ceiling. The price hit the floor of this triangle once and now it is about the middle of this pattern

In the 1-day timeframe, a triangle with bold blue is broken
In the 4-hour time frame, there is an ascending channel with the current price in the middle of this channel. The price can reach the bottom of the canal and then make an upward movement to the canal ceiling
In the 1-hour timeframe, the ascending triangle ceiling marked in white is broken once and returned to the inside of the triangle. So he can break this white line upwards once again
In the 20 minute time frame, we also have a triangular pattern that is formed from the two points of the previous ceiling. The price hit the floor of this triangle once and now it is about the middle of this pattern
Disclaimer
The information and publications are not meant to be, and do not constitute, financial, investment, trading, or other types of advice or recommendations supplied or endorsed by TradingView. Read more in the Terms of Use.
Disclaimer
The information and publications are not meant to be, and do not constitute, financial, investment, trading, or other types of advice or recommendations supplied or endorsed by TradingView. Read more in the Terms of Use.