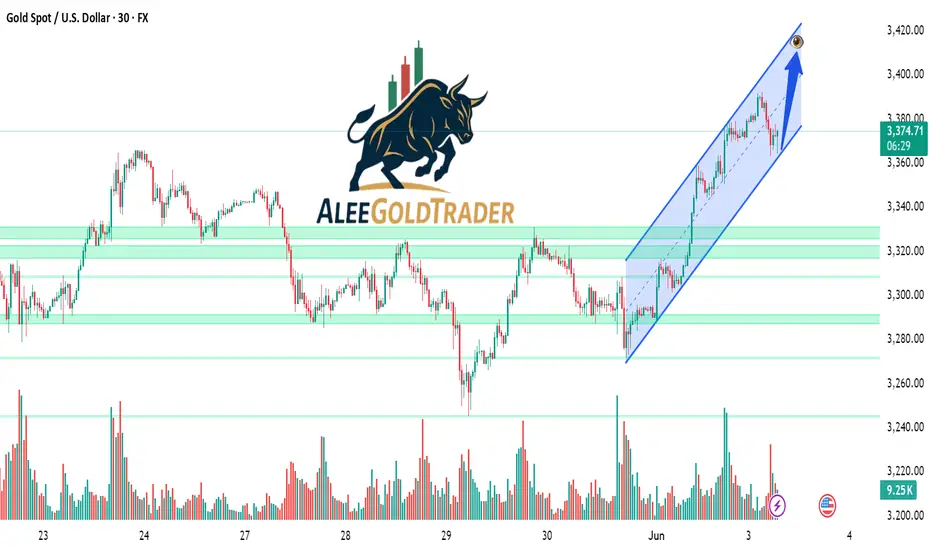
This 30-minute candlestick chart of Gold Spot (XAU/USD) displays a strong bullish trend within an ascending channel marked in blue. Price action has bounced from key support zones (highlighted in green) and is currently retracing within the channel. The chart suggests a potential continuation toward the upper boundary of the channel, around the $3,400–$3,410 level, as indicated by the blue arrow. Key support lies near $3,340 and $3,310, with volume activity showing increased interest on upward moves. The analysis implies bullish momentum may persist if the trend channel remains intact.
Note
This was a classic fakeout scenario—a failed bearish breakout below the ascending channel support. The market has reclaimed structure and is showing bullish intent. As a result, price is now expected to move up towards the next target area around 3410, where the upper resistance aligns with previous supply and the projected channel top.Trade active
JUST LOOK FOR TARGET,INSHAALLAH IT WILL HIT THE TARGET.....Daily XAU/USD FREE setups | Let's grow together!
| XAU/USD Trader | Telegram: https://t.me/Aleegoldsignals
| XAU/USD Trader | Telegram: https://t.me/Aleegoldsignals
Disclaimer
The information and publications are not meant to be, and do not constitute, financial, investment, trading, or other types of advice or recommendations supplied or endorsed by TradingView. Read more in the Terms of Use.
Daily XAU/USD FREE setups | Let's grow together!
| XAU/USD Trader | Telegram: https://t.me/Aleegoldsignals
| XAU/USD Trader | Telegram: https://t.me/Aleegoldsignals
Disclaimer
The information and publications are not meant to be, and do not constitute, financial, investment, trading, or other types of advice or recommendations supplied or endorsed by TradingView. Read more in the Terms of Use.