Gold’s 4-hour chart shows a clear uptrend: price is making higher highs and higher lows, trading above key moving averages and an upward trendline
Analyst ManiMarkets notes “a remarkably robust and sustained uptrend… printing higher highs and higher lows” since late 2024. The nearest major hurdle is around the $3,500 all-time high.
The current structure remains bullish: we have not seen a sustained break of the uptrend, so the overall bias is bullish. In Smart-Money terms, recent price action shows no bearish break of structure on 4H (no BOS), and price is simply consolidating near highs – a bullish sign.
Key zones to watch:
Demand/Order Block (~$3,374–3,380): Around $3,375 is a swing-low and past demand area. It lines up with the 4H EMA50 and 1H EMA200, a classical support confluence.
A strong bullish “order block” (heavy buying zone) sits here – a typical smart-money support area.
Pivot Point (~$3,389): Using the classic pivot formula
On the recent 4H range gives Pivot ≈ 3,389. This acts as a short-term balance point.
Resistance (≈$3,400–3,405): Gold has multiple prior highs around $3,400–3,405 (e.g. the overnight high ~$3,405 and the last swing high ~$3,405) which have been repeatedly tested. Traders are watching a break above ~$3,405 for follow-through. (A recent idea noted gold “bounced off support” near $3,390 and is “looking for a clean sweep of the highs at 3405”.)
Major Resistance ($3,500): The all-time peak around $3,500 is a big psychological barrier.
We expect stiff supply if price approaches 3,500.
Using these levels, the pivot-based support and resistance on the 4H chart are:
Pivot Point: ~$3,389
R1: ~$3,406 (Pivot + 1×range)
R2: ~$3,421 (Pivot + 2×range)
R3: ~$3,437 (Pivot + 3×range)
S1: ~$3,374 (Pivot – 1×range)
S2: ~$3,357 (Pivot – 2×range)
S3: ~$3,342 (Pivot – 3×range)
(These are rough levels using the standard formula on the last 4H high/low.)
Beyond numbers, price-action is key: we look for bullish patterns at support (e.g. bull-engulfing or pin-bar at ~$3,375–3,380) and cautious action near resistance. A brief “liquidity grab” happened at the $3,375 area recently (price wiggled below and then shot back up), which in Smart-Money jargon sweeps stops.
That suggests larger players may have been absorbing buying interest. In short, the tape looks healthy for bulls unless $3,375 breaks decisively. A break of the $3,400–3,405 highs would be a bullish BOS (break of structure), targeting the next supply zone.
Trade Setups (1H, Aligned with Bullish Bias)
Below are three high-probability long setups on the 1-hour chart (in line with the 4H uptrend).
Each is sized for a ~$10 stop from the entry zone.
Buy near $3,374–3,380 (Demand Zone):
Entry: $3,374–3,380 area (around Pivot S1 and the recent swing low).
Direction: Buy.
Stop: ~$3,364 (just below this zone, ~$10 lower).
Targets: ~$3,402 (near Pivot R1/previous high), and then ~$3,420 (around next resistance).
Reason: This zone is a confluence of support – it was a recent 4H low and aligns with EMAs (1H EMA200/4H EMA50)
It acts like a “bull order block” where buyers stepped in
A strong bounce from here keeps the bullish structure intact.
Trigger: Look for a bullish reversal candle on 1H (e.g. an engulfing or pin-bar) forming near $3,375. This confirms rejection of lower prices and signals a buy setup.
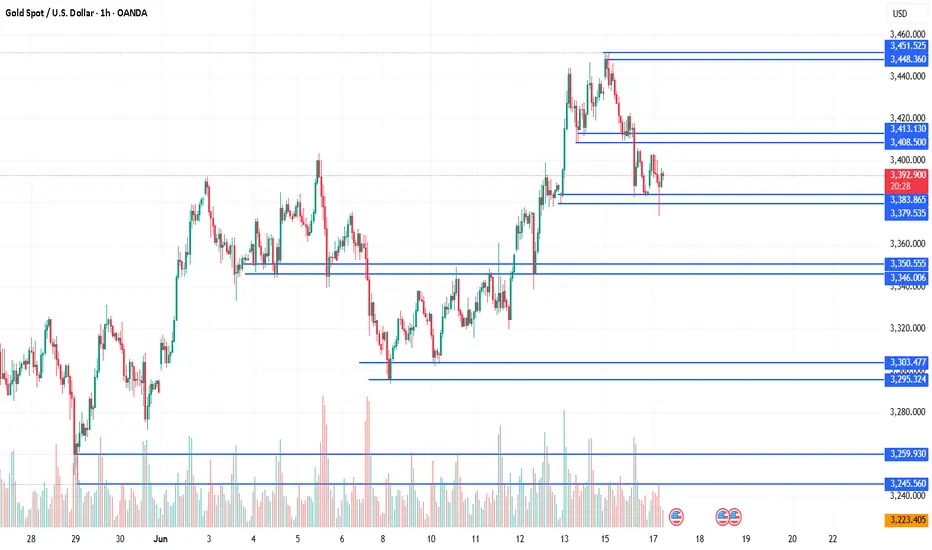
Chart: Example 1H gold chart. Blue shaded area marks the ~$3,374–3,380 buy zone (Pivot S1/EMA support). A bullish reversal candle here would trigger a long entry, targeting $3,402 then $3,420.
Buy break-&-retest at ~$3,402–3,408:
Entry: After a close above ~$3,405, look to buy on a pullback into $3,402–3,408 (just above the old high).
Direction: Buy.
Stop: ~$3,392 (about $10 below the entry zone).
Targets: ~$3,430 (next swing high) and ~$3,450 (round level/upper channel).
Reason: A decisive move above ~$3,405 would mark a BOS (break of the prior high), shifting structure higher. That resistance then becomes support on a retest. This is a classic “breakout retest” entry. (As noted, highs around 3,405 have been tested repeatedly, so breaking them signals strength.)
Trigger: Wait for a 1H candlestick to close firmly above 3,405, then buy on the next pullback into the $3,402–3,408 range with a bullish candle or dip-buy signal.
Buy on pullback to ~$3,385–3,390 (minor higher low):
Entry: $3,385–3,390 if price dips but holds above the 4H pivot (~3,389).
Direction: Buy.
Stop: ~$3,375 (below the entry zone, about $10 down).
Targets: ~$3,420 and ~$3,450 (same as above levels).
Reason: If the market skips Setup 1 and 2, any 1H pullback that still holds above the pivot (creating a higher-low) is another opportunity. Buying this higher-low keeps us aligned with the 4H uptrend. Essentially, we allow price to re-test the pivot area as new demand.
Trigger: A bullish reversal pattern on 1H in the $3,385–3,390 area (for example, a hammer or bullish engulfing) would mark a higher-low and signal a long entry.
Each setup has a tight stop (~$10) just beyond the support zone, and logical profit targets at nearby resistance levels. All assume the 4H trend stays intact. If support fails (e.g. a clean break under $3,374), be ready to reassess.
Takeaway: Gold’s 4H trend is bullish, so focus on buying dips into identified support zones (not shorting). Use tight stops beyond those zones and aim for the next resistance. In practice, that means looking to go long around ~$3,375–3,380 and ~$3,405 (on a clean breakout), riding any bullish continuation toward $3,430–$3,450, while managing risk at each step.
Analyst ManiMarkets notes “a remarkably robust and sustained uptrend… printing higher highs and higher lows” since late 2024. The nearest major hurdle is around the $3,500 all-time high.
The current structure remains bullish: we have not seen a sustained break of the uptrend, so the overall bias is bullish. In Smart-Money terms, recent price action shows no bearish break of structure on 4H (no BOS), and price is simply consolidating near highs – a bullish sign.
Key zones to watch:
Demand/Order Block (~$3,374–3,380): Around $3,375 is a swing-low and past demand area. It lines up with the 4H EMA50 and 1H EMA200, a classical support confluence.
A strong bullish “order block” (heavy buying zone) sits here – a typical smart-money support area.
Pivot Point (~$3,389): Using the classic pivot formula
On the recent 4H range gives Pivot ≈ 3,389. This acts as a short-term balance point.
Resistance (≈$3,400–3,405): Gold has multiple prior highs around $3,400–3,405 (e.g. the overnight high ~$3,405 and the last swing high ~$3,405) which have been repeatedly tested. Traders are watching a break above ~$3,405 for follow-through. (A recent idea noted gold “bounced off support” near $3,390 and is “looking for a clean sweep of the highs at 3405”.)
Major Resistance ($3,500): The all-time peak around $3,500 is a big psychological barrier.
We expect stiff supply if price approaches 3,500.
Using these levels, the pivot-based support and resistance on the 4H chart are:
Pivot Point: ~$3,389
R1: ~$3,406 (Pivot + 1×range)
R2: ~$3,421 (Pivot + 2×range)
R3: ~$3,437 (Pivot + 3×range)
S1: ~$3,374 (Pivot – 1×range)
S2: ~$3,357 (Pivot – 2×range)
S3: ~$3,342 (Pivot – 3×range)
(These are rough levels using the standard formula on the last 4H high/low.)
Beyond numbers, price-action is key: we look for bullish patterns at support (e.g. bull-engulfing or pin-bar at ~$3,375–3,380) and cautious action near resistance. A brief “liquidity grab” happened at the $3,375 area recently (price wiggled below and then shot back up), which in Smart-Money jargon sweeps stops.
That suggests larger players may have been absorbing buying interest. In short, the tape looks healthy for bulls unless $3,375 breaks decisively. A break of the $3,400–3,405 highs would be a bullish BOS (break of structure), targeting the next supply zone.
Trade Setups (1H, Aligned with Bullish Bias)
Below are three high-probability long setups on the 1-hour chart (in line with the 4H uptrend).
Each is sized for a ~$10 stop from the entry zone.
Buy near $3,374–3,380 (Demand Zone):
Entry: $3,374–3,380 area (around Pivot S1 and the recent swing low).
Direction: Buy.
Stop: ~$3,364 (just below this zone, ~$10 lower).
Targets: ~$3,402 (near Pivot R1/previous high), and then ~$3,420 (around next resistance).
Reason: This zone is a confluence of support – it was a recent 4H low and aligns with EMAs (1H EMA200/4H EMA50)
It acts like a “bull order block” where buyers stepped in
A strong bounce from here keeps the bullish structure intact.
Trigger: Look for a bullish reversal candle on 1H (e.g. an engulfing or pin-bar) forming near $3,375. This confirms rejection of lower prices and signals a buy setup.
Chart: Example 1H gold chart. Blue shaded area marks the ~$3,374–3,380 buy zone (Pivot S1/EMA support). A bullish reversal candle here would trigger a long entry, targeting $3,402 then $3,420.
Buy break-&-retest at ~$3,402–3,408:
Entry: After a close above ~$3,405, look to buy on a pullback into $3,402–3,408 (just above the old high).
Direction: Buy.
Stop: ~$3,392 (about $10 below the entry zone).
Targets: ~$3,430 (next swing high) and ~$3,450 (round level/upper channel).
Reason: A decisive move above ~$3,405 would mark a BOS (break of the prior high), shifting structure higher. That resistance then becomes support on a retest. This is a classic “breakout retest” entry. (As noted, highs around 3,405 have been tested repeatedly, so breaking them signals strength.)
Trigger: Wait for a 1H candlestick to close firmly above 3,405, then buy on the next pullback into the $3,402–3,408 range with a bullish candle or dip-buy signal.
Buy on pullback to ~$3,385–3,390 (minor higher low):
Entry: $3,385–3,390 if price dips but holds above the 4H pivot (~3,389).
Direction: Buy.
Stop: ~$3,375 (below the entry zone, about $10 down).
Targets: ~$3,420 and ~$3,450 (same as above levels).
Reason: If the market skips Setup 1 and 2, any 1H pullback that still holds above the pivot (creating a higher-low) is another opportunity. Buying this higher-low keeps us aligned with the 4H uptrend. Essentially, we allow price to re-test the pivot area as new demand.
Trigger: A bullish reversal pattern on 1H in the $3,385–3,390 area (for example, a hammer or bullish engulfing) would mark a higher-low and signal a long entry.
Each setup has a tight stop (~$10) just beyond the support zone, and logical profit targets at nearby resistance levels. All assume the 4H trend stays intact. If support fails (e.g. a clean break under $3,374), be ready to reassess.
Takeaway: Gold’s 4H trend is bullish, so focus on buying dips into identified support zones (not shorting). Use tight stops beyond those zones and aim for the next resistance. In practice, that means looking to go long around ~$3,375–3,380 and ~$3,405 (on a clean breakout), riding any bullish continuation toward $3,430–$3,450, while managing risk at each step.
Note
Contact me to Join our group for free gold trading ideas on daily basisWatsapp Contact +971559939571
Disclaimer
The information and publications are not meant to be, and do not constitute, financial, investment, trading, or other types of advice or recommendations supplied or endorsed by TradingView. Read more in the Terms of Use.
Disclaimer
The information and publications are not meant to be, and do not constitute, financial, investment, trading, or other types of advice or recommendations supplied or endorsed by TradingView. Read more in the Terms of Use.