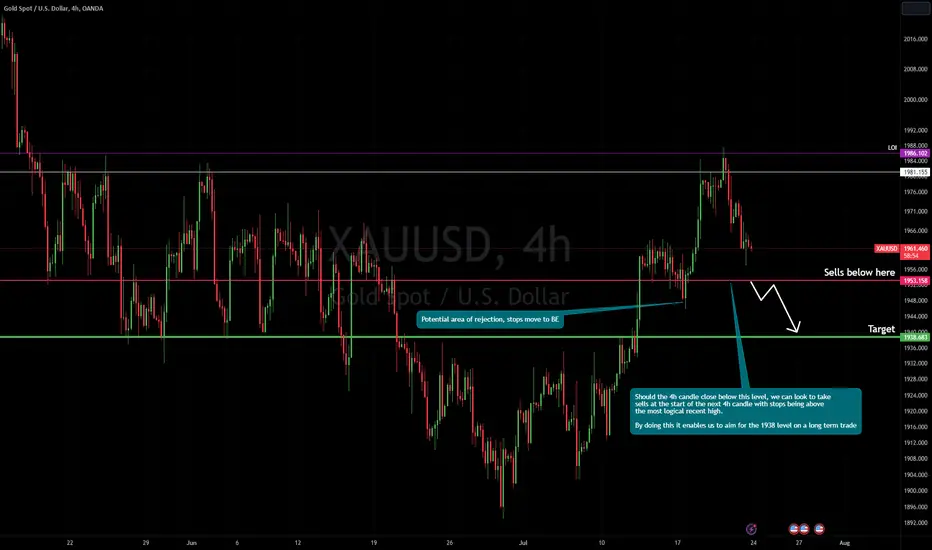
The breakdown of the higher timeframes continue, now onto the 4 hour timeframe.
What we can see is whenever price closes below our sell level, price tends to continue down to our target level.
White arrow shows our most likely price action path.
What we can see is whenever price closes below our sell level, price tends to continue down to our target level.
White arrow shows our most likely price action path.
Disclaimer
The information and publications are not meant to be, and do not constitute, financial, investment, trading, or other types of advice or recommendations supplied or endorsed by TradingView. Read more in the Terms of Use.
Disclaimer
The information and publications are not meant to be, and do not constitute, financial, investment, trading, or other types of advice or recommendations supplied or endorsed by TradingView. Read more in the Terms of Use.