🧠 Conceptual Foundation:
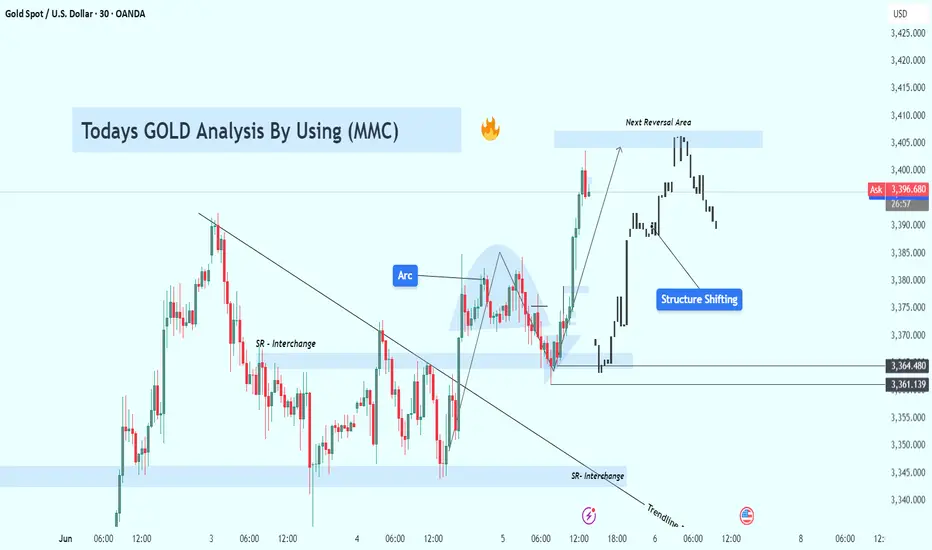
This analysis is rooted in Market Maker Concepts (MMC), focusing on how smart money manipulates liquidity, traps retail traders, and shifts structure before making big moves. The GOLD market today gave us a high-probability setup that combined several key technical elements: SR interchanges, structure shifts, trendline breaks, and a major arc pattern.
Let’s dissect it step-by-step:
1️⃣ Initial Downtrend & Liquidity Sweep
In the early part of the chart, GOLD was in a clear bearish trend, forming lower highs and lower lows, consistently respecting a descending trendline. This downtrend attracted retail sellers who kept entering shorts, reinforcing the bearish sentiment.
🔻 However, right before the reversal, GOLD made a sharp move down to grab liquidity below previous lows near the $3,361–$3,364 support zone. This is a classic MMC liquidity trap — clearing out stop-losses of early buyers before initiating a reversal.
2️⃣ SR Interchange Zones (Smart Money Play)
Around the levels of $3,361 and $3,364, we noticed strong Support-Resistance Interchange (SR Flip) behavior:
These zones were first used as support during the initial decline.
Once broken, they acted as resistance, and again flipped to support post-breakout.
This flip signals institutional involvement — smart money often builds positions in these zones.
These interchanges also acted as the base of accumulation, preparing for a bullish breakout.
3️⃣ Trendline Breakout – Early Reversal Confirmation
As the price consolidated and coiled around the SR zones, it finally broke the descending trendline — a major reversal signal.
This breakout was accompanied by strong bullish candles, showing a sudden shift in momentum. It's likely that smart money stepped in aggressively, initiating a structure shift.
4️⃣ Arc Pattern Formation – Visual Clue of Accumulation
The most eye-catching part of this chart is the arc pattern — a rounded bottom formation. This type of pattern typically indicates accumulation phase, where institutions quietly enter positions while retail sentiment is confused or bearish.
🟡 The arc acts like a pressure cooker: as price coils and liquidity builds, it eventually explodes in the direction of accumulation — in this case, bullish.
5️⃣ Structure Shift – Confirmation of Bullish Intent
Once price broke above the internal structure (previous lower highs), it confirmed a structure shift from bearish to bullish.
📈 This is one of the most critical elements in MMC:
It tells us that smart money has reversed the flow.
The shift often leads to expansive moves in the new direction (as we saw here).
6️⃣ Next Reversal Area (Key Supply Zone)
Price continued surging upward and reached a predefined Reversal Area around $3,405–$3,410. This zone is likely to contain historical supply and institutional sell orders.
As expected:
Price showed early rejection signs from this level.
A potential short-term pullback or distribution phase may now be underway.
If bulls reclaim this zone, it may lead to further upside toward $3,420–$3,430.
📌 Key Technical Highlights:
Component Observation
Trendline Clean break signals momentum shift
SR Interchange Zones Strong demand re-entry near $3,361–$3,364
Arc Pattern Indicates bottoming and accumulation phase
Structure Shift Broke prior lower highs confirming bullish bias
Reversal Zone $3,405–$3,410 acting as resistance; possible rejection/pullback point
🔮 What to Expect Next?
If price rejects the $3,405–$3,410 zone again and forms a lower high, expect a pullback to $3,375–$3,380.
A break above the reversal zone with strong volume may open the door to new highs, targeting $3,420+.
Use caution around news events or high-impact fundamentals (e.g., USD data releases).
💡 Trading Strategy Ideas:
✅ Long Scenario (Already Played Out):
Entry: Post-trendline break + arc confirmation
TP1: Reversal Zone at $3,405
SL: Below $3,361 SR Flip
🔁 Potential Short Setup:
Entry: On bearish confirmation from $3,405–$3,410
TP1: $3,375
TP2: $3,364
SL: Above $3,412 (reversal zone high)
📢 Final Thoughts:
This chart is a great example of how MMC (Market Maker Concepts), when combined with clean price action tools like trendlines, SR zones, and structure shifts, can offer high-accuracy trades.
Don't chase price. Wait for zones to react. Let the market show its hand before taking action.
Related publications
Disclaimer
The information and publications are not meant to be, and do not constitute, financial, investment, trading, or other types of advice or recommendations supplied or endorsed by TradingView. Read more in the Terms of Use.
Related publications
Disclaimer
The information and publications are not meant to be, and do not constitute, financial, investment, trading, or other types of advice or recommendations supplied or endorsed by TradingView. Read more in the Terms of Use.