📊 Market Overview
• Spot gold edged up slightly as the U.S. dollar weakened, but is still heading for a ~1.5% weekly drop as strong U.S. inflation data reduced expectations for significant Fed rate cuts.
• Earlier this week, softer-than-expected U.S. CPI data (up 0.2% in July) briefly lifted gold prices to $3,351.46/oz.
📉 Technical Analysis
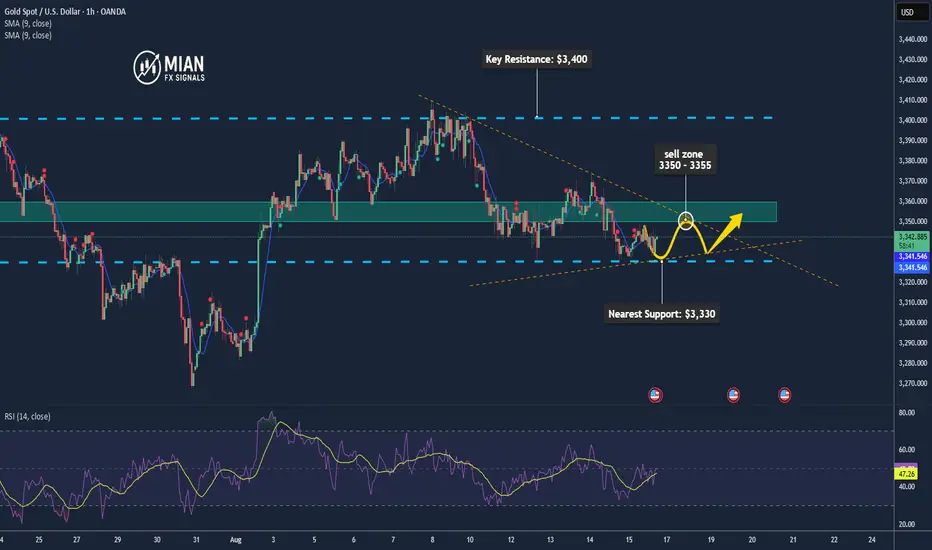
• Key Resistance: ~$3,350–3,360/oz
• Nearest Support: ~$3,330–3,340/oz
• EMA 09:
If price is above EMA09 → short-term trend is bullish.
If price is below EMA09 → trend is bearish
• Candlestick / Volume / Momentum:
Price action is consolidating in a narrow range, showing a cautious market tone.
No significant breakout signals from volume yet.
📌 Outlook
Gold may rise slightly in the short term if the U.S. dollar continues to weaken and inflation data remains soft. However, if incoming data reinforces the view of fewer rate cuts (e.g., higher PPI, lower jobless claims), gold could correct lower.
💡 Suggested Trade Strategy
SELL XAU/USD: $3,350–3,355
🎯 TP: ~$3,330–3,340
❌ SL: ~$3,360
BUY XAU/USD: $3,330–3,335
🎯 TP: ~$3,350–3,360
❌ SL: ~$3,320
• Spot gold edged up slightly as the U.S. dollar weakened, but is still heading for a ~1.5% weekly drop as strong U.S. inflation data reduced expectations for significant Fed rate cuts.
• Earlier this week, softer-than-expected U.S. CPI data (up 0.2% in July) briefly lifted gold prices to $3,351.46/oz.
📉 Technical Analysis
• Key Resistance: ~$3,350–3,360/oz
• Nearest Support: ~$3,330–3,340/oz
• EMA 09:
If price is above EMA09 → short-term trend is bullish.
If price is below EMA09 → trend is bearish
• Candlestick / Volume / Momentum:
Price action is consolidating in a narrow range, showing a cautious market tone.
No significant breakout signals from volume yet.
📌 Outlook
Gold may rise slightly in the short term if the U.S. dollar continues to weaken and inflation data remains soft. However, if incoming data reinforces the view of fewer rate cuts (e.g., higher PPI, lower jobless claims), gold could correct lower.
💡 Suggested Trade Strategy
SELL XAU/USD: $3,350–3,355
🎯 TP: ~$3,330–3,340
❌ SL: ~$3,360
BUY XAU/USD: $3,330–3,335
🎯 TP: ~$3,350–3,360
❌ SL: ~$3,320
Trade active
Next week, gold is likely to fluctuate around **\$3,300–\$3,360/oz**, with downside risk if the USD strengthens but maintaining a medium-term bullish outlook toward **\$3,500** on Fed easing expectations and safe-haven demand.Trade closed: target reached
Gold today is likely to move sideways around $3,350/oz, with a slight bullish bias if no unexpected news emerges.📊 Forex | Gold | Crypto Market Insights & Signals
📰 Real-time news updates & expert analysis
📈 Daily Buy/Sell signals for investors
💡 Technical breakdowns & market outlooks
🔗 Join our free group: t.me/+DmS-dVFJMm40MDM9
📰 Real-time news updates & expert analysis
📈 Daily Buy/Sell signals for investors
💡 Technical breakdowns & market outlooks
🔗 Join our free group: t.me/+DmS-dVFJMm40MDM9
Related publications
Disclaimer
The information and publications are not meant to be, and do not constitute, financial, investment, trading, or other types of advice or recommendations supplied or endorsed by TradingView. Read more in the Terms of Use.
📊 Forex | Gold | Crypto Market Insights & Signals
📰 Real-time news updates & expert analysis
📈 Daily Buy/Sell signals for investors
💡 Technical breakdowns & market outlooks
🔗 Join our free group: t.me/+DmS-dVFJMm40MDM9
📰 Real-time news updates & expert analysis
📈 Daily Buy/Sell signals for investors
💡 Technical breakdowns & market outlooks
🔗 Join our free group: t.me/+DmS-dVFJMm40MDM9
Related publications
Disclaimer
The information and publications are not meant to be, and do not constitute, financial, investment, trading, or other types of advice or recommendations supplied or endorsed by TradingView. Read more in the Terms of Use.