🧠 Overview
As global tensions escalate and risk sentiment deteriorates, it’s worth revisiting how major asset classes behaved during past war scenarios. The Gulf War (July 1990 – March 1991) offers a clean case study with distinct phases of market psychology.
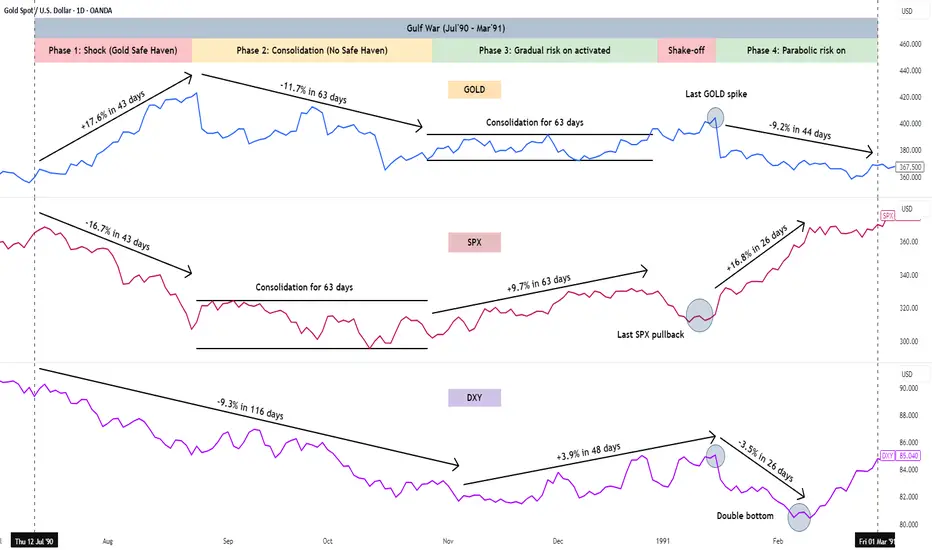
📊 What This Chart Shows
A synchronized visual comparison of:
Gold – Classic safe haven behavior
S&P 500 – Risk asset sentiment
DXY – USD demand during crisis
🧭 Phases Identified
Phase 1 – Shock
📈 Gold spikes | 📉 Stocks crash | 📉 USD weakens
→ Panic phase as markets price in uncertainty
Phase 2 – Consolidation
Market stalls, both risk and safe haven flows stabilize.
Phase 3 – Gradual Risk-On
Equities begin recovering as risk appetite cautiously returns.
Phase 4 – Shake-Off & Parabolic Rally
Gold rolls over, stocks go parabolic, and DXY forms a double bottom.
🔍 Key Insights
🟡 Gold surged +17% in 43 days, then faded
🔴 SPX dropped -17%, then reversed with a +26% rally
🟣 DXY fell -9%, but rebounded sharply later
⏱️ Timing matters: Safe havens perform early — but are not eternal shelters.
💡 Why It Matters Today
If current geopolitical risks evolve into a Gulf War-type scenario, we might observe:
🟡 A first wave into Gold or USD
🔁 A rotation back into risk assets as clarity improves
📈 Opportunities for reversals in oversold names
This chart is not a forecast — it’s a framework. Patterns may not repeat, but they often rhyme.
✍️ Ongoing Series
This is part of a multi-part series exploring how markets react to war and crisis. Future posts will include:
Iraq War
Russia-Ukraine 2022
9/11 aftermath
COVID-19 as a “war-like” shock
📌 Follow for the next studies.
🧷 Chart: Gold, SPX & DXY during the Gulf War
🔖 Annotated and structured by fredcast80
As global tensions escalate and risk sentiment deteriorates, it’s worth revisiting how major asset classes behaved during past war scenarios. The Gulf War (July 1990 – March 1991) offers a clean case study with distinct phases of market psychology.
📊 What This Chart Shows
A synchronized visual comparison of:
Gold – Classic safe haven behavior
S&P 500 – Risk asset sentiment
DXY – USD demand during crisis
🧭 Phases Identified
Phase 1 – Shock
📈 Gold spikes | 📉 Stocks crash | 📉 USD weakens
→ Panic phase as markets price in uncertainty
Phase 2 – Consolidation
Market stalls, both risk and safe haven flows stabilize.
Phase 3 – Gradual Risk-On
Equities begin recovering as risk appetite cautiously returns.
Phase 4 – Shake-Off & Parabolic Rally
Gold rolls over, stocks go parabolic, and DXY forms a double bottom.
🔍 Key Insights
🟡 Gold surged +17% in 43 days, then faded
🔴 SPX dropped -17%, then reversed with a +26% rally
🟣 DXY fell -9%, but rebounded sharply later
⏱️ Timing matters: Safe havens perform early — but are not eternal shelters.
💡 Why It Matters Today
If current geopolitical risks evolve into a Gulf War-type scenario, we might observe:
🟡 A first wave into Gold or USD
🔁 A rotation back into risk assets as clarity improves
📈 Opportunities for reversals in oversold names
This chart is not a forecast — it’s a framework. Patterns may not repeat, but they often rhyme.
✍️ Ongoing Series
This is part of a multi-part series exploring how markets react to war and crisis. Future posts will include:
Iraq War
Russia-Ukraine 2022
9/11 aftermath
COVID-19 as a “war-like” shock
📌 Follow for the next studies.
🧷 Chart: Gold, SPX & DXY during the Gulf War
🔖 Annotated and structured by fredcast80
Disclaimer
The information and publications are not meant to be, and do not constitute, financial, investment, trading, or other types of advice or recommendations supplied or endorsed by TradingView. Read more in the Terms of Use.
Disclaimer
The information and publications are not meant to be, and do not constitute, financial, investment, trading, or other types of advice or recommendations supplied or endorsed by TradingView. Read more in the Terms of Use.