This is very similar to the NZDUSD weekly chart.
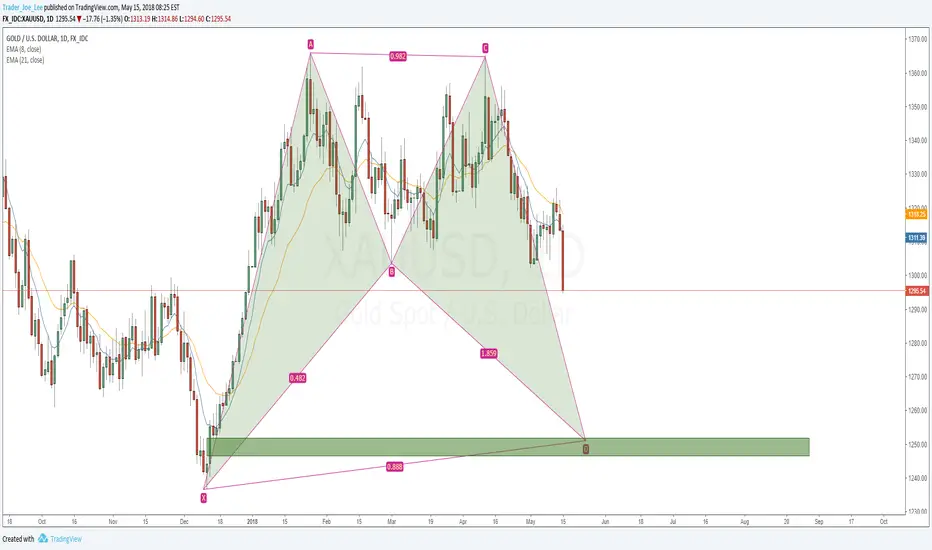
It just broke the B point, which means if I want to look for buy-low opportunity on daily chart,
I will only be interesting in this bat near 1250.
That is, without a daily reversal sign or a strong bounce that breaks some important pivot,
I will only look for trades to short gold recently, no matter sell-high strategies or chase-low strategies!
Let's see how it goes.
Note
CD Moves forward, not so far from the potential entry yo!Note
Here you are, kinda turning short-term bullish before breaking 1235.00Related publications
Disclaimer
The information and publications are not meant to be, and do not constitute, financial, investment, trading, or other types of advice or recommendations supplied or endorsed by TradingView. Read more in the Terms of Use.
Related publications
Disclaimer
The information and publications are not meant to be, and do not constitute, financial, investment, trading, or other types of advice or recommendations supplied or endorsed by TradingView. Read more in the Terms of Use.