📊 Market Summary:
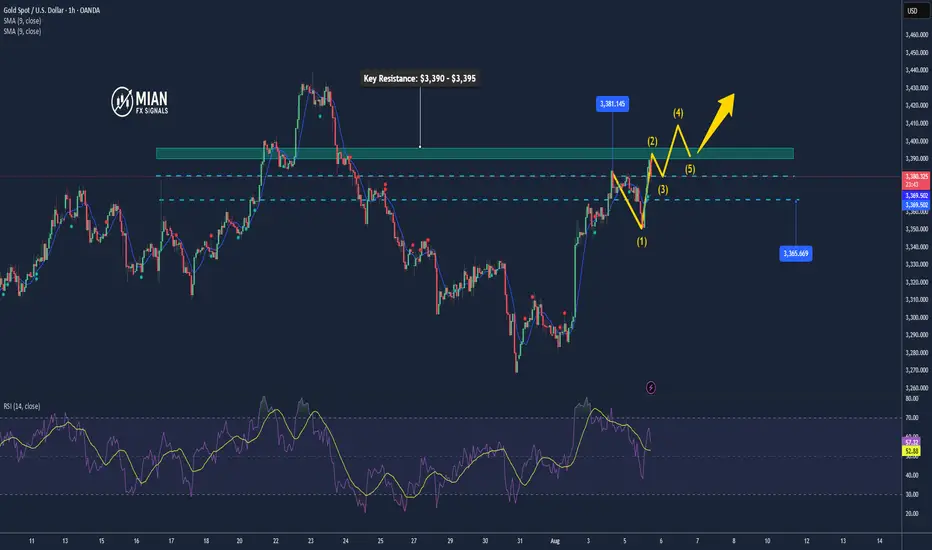
Gold surged past the $3,385 resistance to reach a new high at $3,390, driven by weaker-than-expected ISM Services PMI data. The U.S. dollar softened and Treasury yields dipped, fueling the rally. However, after hitting the peak, some profit-taking emerged, causing gold to pull back slightly and currently trade around $3,383.
________________________________________
📉 Technical Analysis:
• Key Resistance:
$3,390–$3,395 – short-term local high. If this zone breaks, the next target is $3,400+.
• Nearest Support:
$3,380, followed by the previous breakout level at $3,365, both likely to act as support during any pullback.
• EMA 09 (Daily):
Price remains above the 9-day EMA, confirming the continuation of the short-term uptrend.
• Momentum / Volume / Candlestick:
RSI is holding above 60 – bullish. However, a long upper wick near $3,390 suggests short-term selling pressure or hesitation.
________________________________________
📌 Outlook:
Gold is showing bullish momentum, with the uptrend confirmed after breaking above $3,385. If price holds above $3,380, there's a strong possibility of testing the $3,400 level. However, a failure to sustain above this zone could lead to a retest of $3,365.
________________________________________
💡 Suggested Trade Strategy:
🔺 BUY XAU/USD : $3,380–$3,383
🎯 TP: 40/80/200 pips
❌ SL: $3,377
Trade active
Gold price holds a slight bullish bias today if it stays above $3,355; a drop below $3,330 could lead to deeper losses.Trade closed: target reached
Gold is moving sideways around $3,375; a breakout above $3,380 may lead to further gains, while a drop below $3,370 could signal a pullback toward $3,345.📊 Forex | Gold | Crypto Market Insights & Signals
📰 Real-time news updates & expert analysis
📈 Daily Buy/Sell signals for investors
💡 Technical breakdowns & market outlooks
🔗 Join our free group: t.me/+DmS-dVFJMm40MDM9
📰 Real-time news updates & expert analysis
📈 Daily Buy/Sell signals for investors
💡 Technical breakdowns & market outlooks
🔗 Join our free group: t.me/+DmS-dVFJMm40MDM9
Related publications
Disclaimer
The information and publications are not meant to be, and do not constitute, financial, investment, trading, or other types of advice or recommendations supplied or endorsed by TradingView. Read more in the Terms of Use.
📊 Forex | Gold | Crypto Market Insights & Signals
📰 Real-time news updates & expert analysis
📈 Daily Buy/Sell signals for investors
💡 Technical breakdowns & market outlooks
🔗 Join our free group: t.me/+DmS-dVFJMm40MDM9
📰 Real-time news updates & expert analysis
📈 Daily Buy/Sell signals for investors
💡 Technical breakdowns & market outlooks
🔗 Join our free group: t.me/+DmS-dVFJMm40MDM9
Related publications
Disclaimer
The information and publications are not meant to be, and do not constitute, financial, investment, trading, or other types of advice or recommendations supplied or endorsed by TradingView. Read more in the Terms of Use.