Information summary:
This week, the market continued to be affected by Trump's tariff policy and the progress of negotiations. On Thursday, the phone call between the Chinese and US heads of state boosted market sentiment. In the early stage, the precious metals market ushered in a collective rise, and the prices of silver and gold performed strongly. Silver rose to a 13-year high on Thursday, breaking through $36 for the first time since February 2012.
After gold hit the $3,400 mark during trading on Thursday, the US dollar rose as friendly talks between China and the United States stimulated the rise of the US dollar; gold fell rapidly and gave up all the gains during the day. On Friday, the US stock market closed at its highest level since February due to the boost of non-agricultural data.
Gold continued its retreat trend again, closing at around 3,310 as of Friday.
Market analysis:
From the trend of the US dollar, there is already an opportunity to bottom out, and the trend at the beginning of the week is critical.

Once the US dollar stands above 99.5 at the beginning of the week, it will continue to touch the 100.0--100.2 mark.
If it stabilizes above this position, gold will most likely fall below 3300 next week.
First, from the weekly chart:

The current moving average support below the weekly line is almost at 3250-3260. If it can hold here, gold may continue to maintain consolidation and wait for an opportunity to choose a new trend. However, if it falls below 3250, it can fall to the 3200 mark. If 3200 falls below again, it will be the low point of 3100.
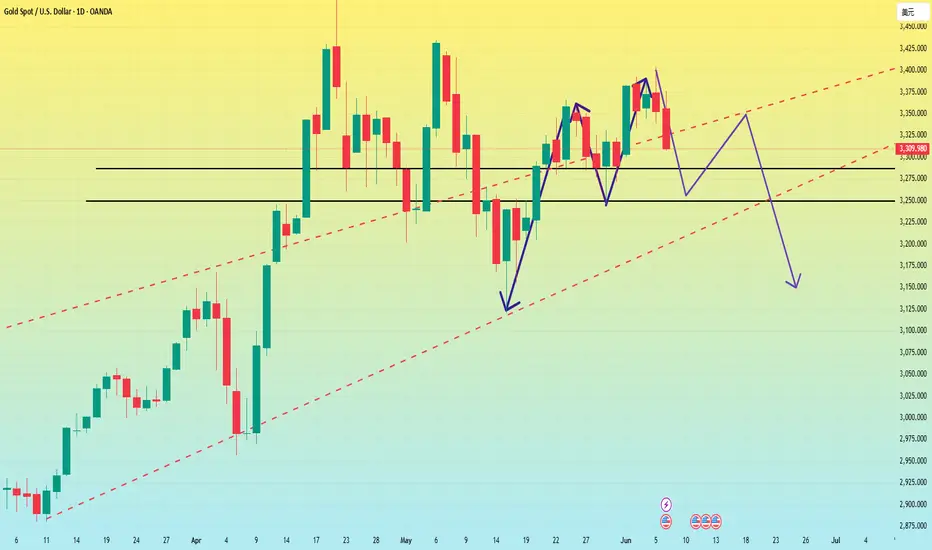
It can also be seen from the daily chart that the important position of gold is at 3318-3280. If it stands above 3318, gold is in a bullish upward trend. If it falls below 3280, gold will enter a bearish trend. At present, gold has closed below 3318, so from the daily line, the next target is around 3280. If 3280 falls below again, then as the weekly analysis shows, it will test 3250-3260. However, judging from the daily chart, I think the market will not go down too easily.
Therefore, I guess that gold may follow the head and shoulders top structure of the daily chart next week. It may fall to 3250-3260 at the beginning of the week to lure short sellers into the market, and then stretch and rebound to around 3350 to form a shoulder position. Finally, it will directly dive down to around 3150.
The Asian market is about to open, and I hope my analysis can help everyone make some profits in the market. A new week is about to begin, and I wish you all good luck.
This week, the market continued to be affected by Trump's tariff policy and the progress of negotiations. On Thursday, the phone call between the Chinese and US heads of state boosted market sentiment. In the early stage, the precious metals market ushered in a collective rise, and the prices of silver and gold performed strongly. Silver rose to a 13-year high on Thursday, breaking through $36 for the first time since February 2012.
After gold hit the $3,400 mark during trading on Thursday, the US dollar rose as friendly talks between China and the United States stimulated the rise of the US dollar; gold fell rapidly and gave up all the gains during the day. On Friday, the US stock market closed at its highest level since February due to the boost of non-agricultural data.
Gold continued its retreat trend again, closing at around 3,310 as of Friday.
Market analysis:
From the trend of the US dollar, there is already an opportunity to bottom out, and the trend at the beginning of the week is critical.
Once the US dollar stands above 99.5 at the beginning of the week, it will continue to touch the 100.0--100.2 mark.
If it stabilizes above this position, gold will most likely fall below 3300 next week.
First, from the weekly chart:
The current moving average support below the weekly line is almost at 3250-3260. If it can hold here, gold may continue to maintain consolidation and wait for an opportunity to choose a new trend. However, if it falls below 3250, it can fall to the 3200 mark. If 3200 falls below again, it will be the low point of 3100.
It can also be seen from the daily chart that the important position of gold is at 3318-3280. If it stands above 3318, gold is in a bullish upward trend. If it falls below 3280, gold will enter a bearish trend. At present, gold has closed below 3318, so from the daily line, the next target is around 3280. If 3280 falls below again, then as the weekly analysis shows, it will test 3250-3260. However, judging from the daily chart, I think the market will not go down too easily.
Therefore, I guess that gold may follow the head and shoulders top structure of the daily chart next week. It may fall to 3250-3260 at the beginning of the week to lure short sellers into the market, and then stretch and rebound to around 3350 to form a shoulder position. Finally, it will directly dive down to around 3150.
The Asian market is about to open, and I hope my analysis can help everyone make some profits in the market. A new week is about to begin, and I wish you all good luck.
Related publications
Disclaimer
The information and publications are not meant to be, and do not constitute, financial, investment, trading, or other types of advice or recommendations supplied or endorsed by TradingView. Read more in the Terms of Use.
Related publications
Disclaimer
The information and publications are not meant to be, and do not constitute, financial, investment, trading, or other types of advice or recommendations supplied or endorsed by TradingView. Read more in the Terms of Use.