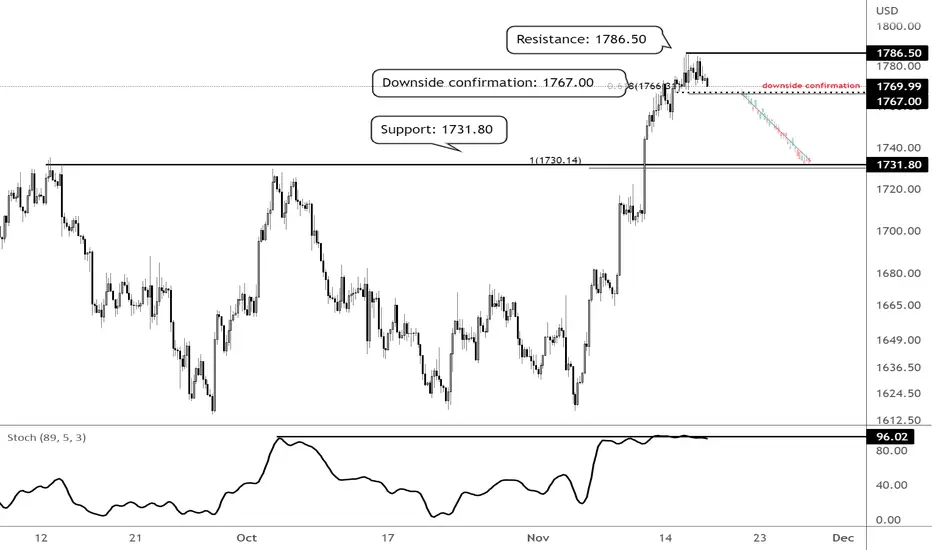
On the H4 time frame, prices are facing bearish pressure from the resistance at 1786.50, in line with the graphical resistance zone. A break below the downside confirmation level at 1767.00 could provide a bearish acceleration to the next support zone at 1731.80, which coincides with the graphical resistance-turned-support level and 100% Fibonacci extension. Stochastic is testing resistance at 96.02 as well where we could see a reversal below this level.
Disclaimer
The information and publications are not meant to be, and do not constitute, financial, investment, trading, or other types of advice or recommendations supplied or endorsed by TradingView. Read more in the Terms of Use.
Disclaimer
The information and publications are not meant to be, and do not constitute, financial, investment, trading, or other types of advice or recommendations supplied or endorsed by TradingView. Read more in the Terms of Use.