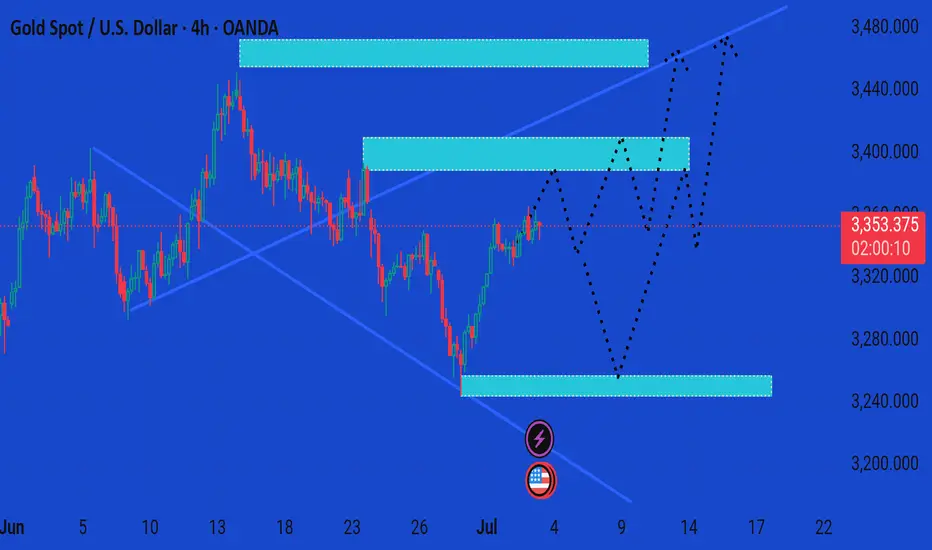
This chart presents a 4-hour analysis of Gold Spot (XAU/USD) against the US Dollar, showing potential bullish scenarios based on price zones and market reactions.
Key Insights:
Current Price:
$3,353.31, slightly down 0.11%.
---
Highlighted Zones:
1. Resistance Zone (~$3,420–$3,455):
Price reacted here previously.
Marked as a potential final target for bullish momentum.
2. Mid Supply/Resistance Zone (~$3,370–$3,405):
Critical decision area.
Price might face consolidation or rejection.
3. Demand Zone (~$3,240–$3,270):
Previously respected support.
Ideal area for a bullish reversal if price dips.
---
Projected Price Paths (Black Dotted Lines):
Scenario A (Immediate Bullish):
Price consolidates above $3,350.
Breaks into the mid-zone, then pushes to $3,450 resistance.
Scenario B (Pullback Then Rally):
Declines to the $3,250 demand zone.
Rebounds strongly, breaks mid-zone, and heads for $3,450.
Scenario C (Range-bound):
Multiple bounces between $3,250 and $3,405 before a decisive breakout.
---
Conclusion:
The chart suggests a bullish bias as long as price holds above the $3,250 support zone. Breakout confirmation above $3,405 could pave the way toward $3,450+. However, a drop below the demand zone would invalidate the bullish outlook short-term.
Would you like a trading plan based on these scenarios?
t.me/+EQ88IkMSUvQwMGJk
Join telegram channel free
t.me/+EQ88IkMSUvQwMGJk
Join telegram channel free
t.me/+EQ88IkMSUvQwMGJk
Related publications
Disclaimer
The information and publications are not meant to be, and do not constitute, financial, investment, trading, or other types of advice or recommendations supplied or endorsed by TradingView. Read more in the Terms of Use.
t.me/+EQ88IkMSUvQwMGJk
Join telegram channel free
t.me/+EQ88IkMSUvQwMGJk
Join telegram channel free
t.me/+EQ88IkMSUvQwMGJk
Related publications
Disclaimer
The information and publications are not meant to be, and do not constitute, financial, investment, trading, or other types of advice or recommendations supplied or endorsed by TradingView. Read more in the Terms of Use.