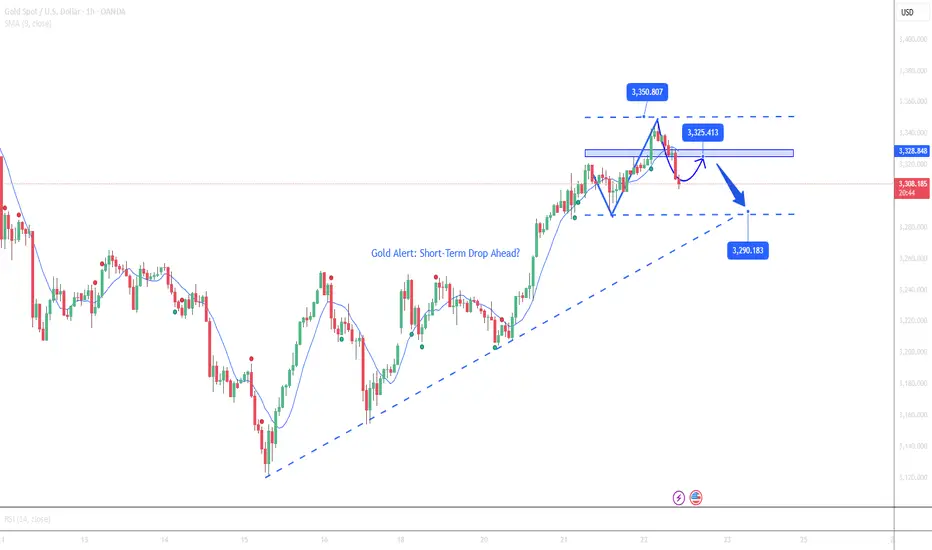
Gold is showing clear signs of weakness after failing to break the strong resistance level at $3350/oz. Bullish momentum has faded as gold broke below the $3325 support and continued its decline, now trading around $3310. Current technical signals indicate that the downtrend remains dominant, and there is a high probability that gold will continue correcting toward the $3290 support level, possibly even testing the $3225 area if the bearish pressure persists.
📰 Key Economic Data Scheduled for Today (U.S.):
• Unemployment Claims
• Flash Manufacturing PMI
• Flash Services PMI
These reports could trigger strong short-term volatility, especially if the data is positive and strengthens expectations that the Fed will maintain a tight monetary policy. This scenario could put further downward pressure on gold, as the USD strengthens and Treasury yields rise.
⚠️ Recommendation: Investors are advised to avoid trading during news releases to minimize risk from high volatility.
🔍 Short-Term Technical Analysis:
• Key Resistance: $3350 – remains unbroken, confirming weakening buying power.
• Nearest Support: $3290 – crucial level to monitor if the downtrend continues.
• Deeper Support: $3225 – could be tested if no strong rebound occurs.
• Short-Term EMA: Price is currently below the EMA 09, signaling further downside momentum.
• Bearish Candlestick Pattern: Series of long red candles reinforce the ongoing bearish trend.
💡 Short-Term Trade Scenarios:
SELL XAU/USD Zone : 3325$ - 3328
💰 TP : 3310 - 3313
🚨 SL $3335
BUY XAU/USD Zone: 3288$ - 3290$
💰 TP : 3313 – 3315
🚨 SL $3283
📊 Forex | Gold | Crypto Market Insights & Signals
📰 Real-time news updates & expert analysis
📈 Daily Buy/Sell signals for investors
💡 Technical breakdowns & market outlooks
🔗 Join our free group: t.me/+DmS-dVFJMm40MDM9
📰 Real-time news updates & expert analysis
📈 Daily Buy/Sell signals for investors
💡 Technical breakdowns & market outlooks
🔗 Join our free group: t.me/+DmS-dVFJMm40MDM9
Related publications
Disclaimer
The information and publications are not meant to be, and do not constitute, financial, investment, trading, or other types of advice or recommendations supplied or endorsed by TradingView. Read more in the Terms of Use.