Market News:
Spot gold prices fluctuated at high levels in early Asian trading on Monday (August 4), currently trading around $3,349 per ounce. Gold prices surged by over 2% last Friday (August 1), reaching a weekly high. This is due to the fact that US July non-farm payroll data fell far short of expectations, increasing the likelihood of a Federal Reserve rate cut. Furthermore, Trump's new round of tariff announcements has fueled safe-haven demand. Global economic uncertainty, a weakening US dollar, and rising expectations of a Fed rate cut have all provided strong momentum for the rise in international gold prices.
Against the backdrop of continued global economic uncertainty, gold's appeal as a safe-haven asset is expected to further increase. Investors should closely monitor market trends to seize potential opportunities. This trading day, attention should be paid to the US June factory orders monthly rate and continued monitoring of news related to the international trade and geopolitical situation.
Technical Analysis:
From a macro perspective, the monthly chart shows four consecutive long upper shadows and three dojis. This high-level doji formation in an uptrend is overwhelming, prompting caution in buying and caution in the market. Be wary of potential sell-offs in the future. We have repeatedly emphasized the importance of the monthly gold chart in recent months!
On a weekly basis, gold bottomed out and rebounded last week, hitting the middle support band and rebounding. Prices remain within the range, currently shrinking to 3268-3438. The Bollinger Bands continue to close, while the MA5 and MA10 levels remain in a volatile pattern. A unilateral trend still needs time to develop. On a daily basis, there was an extreme rally on Friday night, with the daily chart closing with a large real bullish candlestick. The price directly broke through the short-term moving average and the middle support band, forming a strong Yang-enclosing-Yin pattern. This is a positive bullish signal. So, is it a good time to buy on Monday?
I personally don't recommend buying directly from high levels. Gold rebounded from 3268, surging nearly $100 over two trading days without a significant pullback. Even if there was a pullback on Thursday, it was a single-digit pattern, which doesn't provide solid support for a bullish rally. Therefore, I don't recommend chasing long positions. Instead, watch for a potential sell-off after a rally. Focus on resistance at 618 and resistance near 3376, a previous top-bottom reversal.
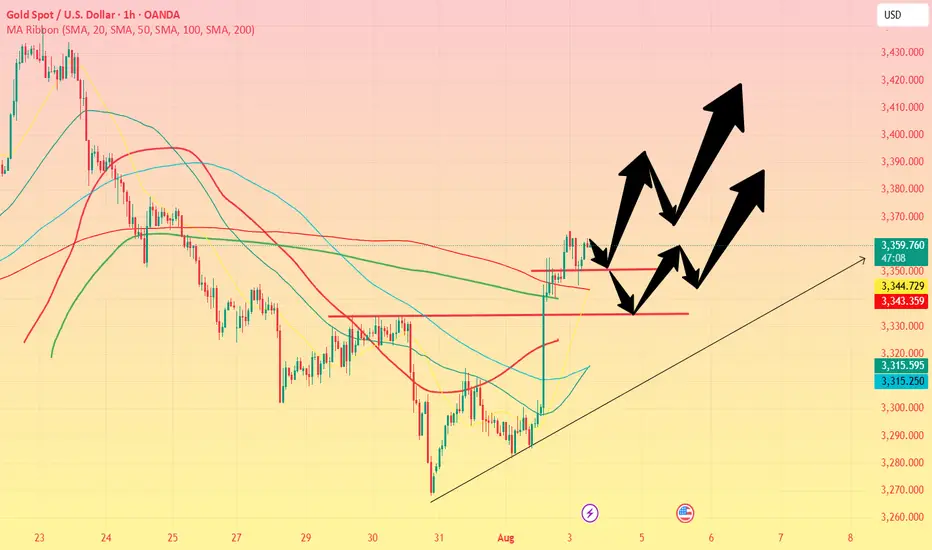
Looking at gold on both the 4-hour and hourly charts, the Bollinger Bands are showing signs of opening after last Friday's surge. However, it's important to note that such surge-like openings are generally not sustainable, and will close again upon retracing technical indicators. The 4-hour candlestick chart is currently trading above the upper band, no longer favoring a buy-now-up move. The 1-hour moving average is blunting, and the upper band of the Bollinger Band is about to close. Overall, while gold is strong, it's best not to chase the bulls. Focus on selling opportunities on rallies today, and then consider a bullish move after a pullback.
Trading strategy:
Short-term gold: Buy at 3330-3333, stop loss at 3322, target at 3360-3380;
Short-term gold: Sell at 3375-3378, stop loss at 3387, target at 3340-3320;
Key points:
First support level: 3342, second support level: 3330, third support level: 3316
First resistance level: 3376, second resistance level: 3388, third resistance level: 3400
Spot gold prices fluctuated at high levels in early Asian trading on Monday (August 4), currently trading around $3,349 per ounce. Gold prices surged by over 2% last Friday (August 1), reaching a weekly high. This is due to the fact that US July non-farm payroll data fell far short of expectations, increasing the likelihood of a Federal Reserve rate cut. Furthermore, Trump's new round of tariff announcements has fueled safe-haven demand. Global economic uncertainty, a weakening US dollar, and rising expectations of a Fed rate cut have all provided strong momentum for the rise in international gold prices.
Against the backdrop of continued global economic uncertainty, gold's appeal as a safe-haven asset is expected to further increase. Investors should closely monitor market trends to seize potential opportunities. This trading day, attention should be paid to the US June factory orders monthly rate and continued monitoring of news related to the international trade and geopolitical situation.
Technical Analysis:
From a macro perspective, the monthly chart shows four consecutive long upper shadows and three dojis. This high-level doji formation in an uptrend is overwhelming, prompting caution in buying and caution in the market. Be wary of potential sell-offs in the future. We have repeatedly emphasized the importance of the monthly gold chart in recent months!
On a weekly basis, gold bottomed out and rebounded last week, hitting the middle support band and rebounding. Prices remain within the range, currently shrinking to 3268-3438. The Bollinger Bands continue to close, while the MA5 and MA10 levels remain in a volatile pattern. A unilateral trend still needs time to develop. On a daily basis, there was an extreme rally on Friday night, with the daily chart closing with a large real bullish candlestick. The price directly broke through the short-term moving average and the middle support band, forming a strong Yang-enclosing-Yin pattern. This is a positive bullish signal. So, is it a good time to buy on Monday?
I personally don't recommend buying directly from high levels. Gold rebounded from 3268, surging nearly $100 over two trading days without a significant pullback. Even if there was a pullback on Thursday, it was a single-digit pattern, which doesn't provide solid support for a bullish rally. Therefore, I don't recommend chasing long positions. Instead, watch for a potential sell-off after a rally. Focus on resistance at 618 and resistance near 3376, a previous top-bottom reversal.
Looking at gold on both the 4-hour and hourly charts, the Bollinger Bands are showing signs of opening after last Friday's surge. However, it's important to note that such surge-like openings are generally not sustainable, and will close again upon retracing technical indicators. The 4-hour candlestick chart is currently trading above the upper band, no longer favoring a buy-now-up move. The 1-hour moving average is blunting, and the upper band of the Bollinger Band is about to close. Overall, while gold is strong, it's best not to chase the bulls. Focus on selling opportunities on rallies today, and then consider a bullish move after a pullback.
Trading strategy:
Short-term gold: Buy at 3330-3333, stop loss at 3322, target at 3360-3380;
Short-term gold: Sell at 3375-3378, stop loss at 3387, target at 3340-3320;
Key points:
First support level: 3342, second support level: 3330, third support level: 3316
First resistance level: 3376, second resistance level: 3388, third resistance level: 3400
Disclaimer
The information and publications are not meant to be, and do not constitute, financial, investment, trading, or other types of advice or recommendations supplied or endorsed by TradingView. Read more in the Terms of Use.
Disclaimer
The information and publications are not meant to be, and do not constitute, financial, investment, trading, or other types of advice or recommendations supplied or endorsed by TradingView. Read more in the Terms of Use.