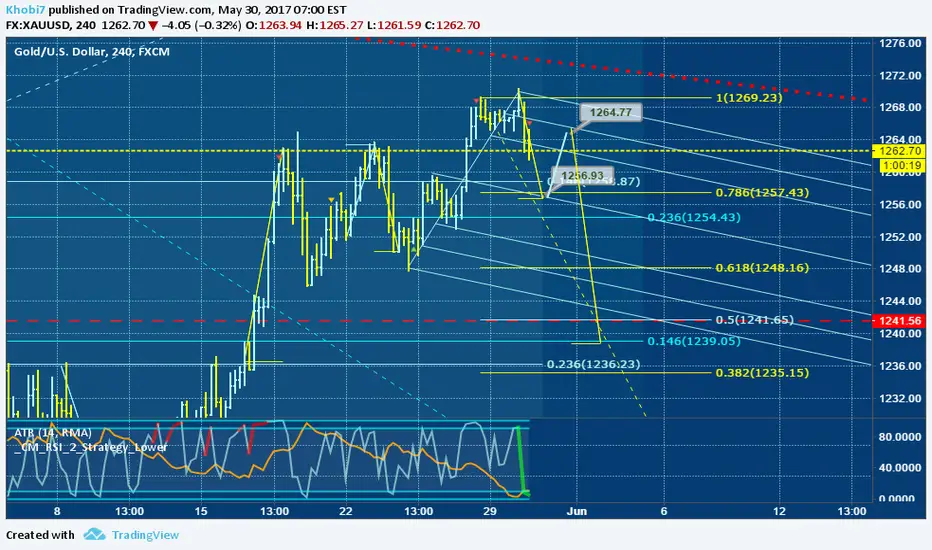
As the price drop through it, then 1258-56 might test.
But breaking down below 1256 paves the way for 1241 ( red-line = resistance ).
Just an estimate ^^!
So lets pay attention.
But breaking down below 1256 paves the way for 1241 ( red-line = resistance ).
Just an estimate ^^!
So lets pay attention.
Trade closed manually
the price keep rising after hitting the 1264.77 level, so i would like to close on this second round, which wont expect it to drop to the red-line down to the 50% of fib ( blue )Related publications
Disclaimer
The information and publications are not meant to be, and do not constitute, financial, investment, trading, or other types of advice or recommendations supplied or endorsed by TradingView. Read more in the Terms of Use.
Related publications
Disclaimer
The information and publications are not meant to be, and do not constitute, financial, investment, trading, or other types of advice or recommendations supplied or endorsed by TradingView. Read more in the Terms of Use.