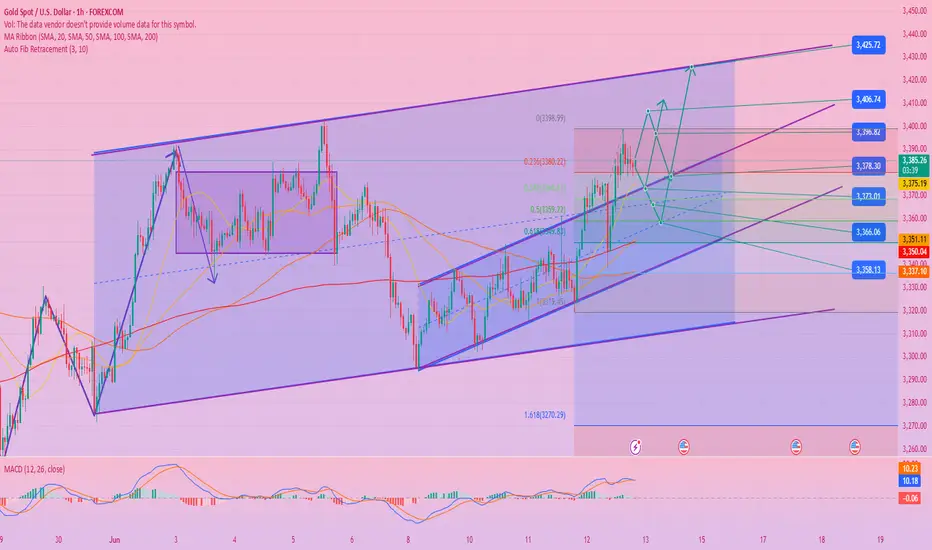
Gold multi-period resonance analysis
1. Daily level - trend strengthening stage
Structural breakthrough: The price effectively stood above the 3350 neckline (the upper edge of the previous oscillation range), and the daily closing was "engulfing the positive line", confirming the bullish dominance.
Moving average system: 5/10/20-day moving averages are arranged in a bullish pattern, MACD double lines diverge upward from the zero axis, and RSI (14) remains above 60 without overbought.
Key pressure: 3390-3400 area (weekly Fibonacci 78.6% retracement level).
2. 4-hour level - momentum verification
Wave structure: The 3320 low point can be regarded as the end of wave C, and the current running is sub-wave 3 of driving wave 3, with a theoretical target of 3415 (1.618 extension level).
Volume and price coordination: The rise is accompanied by an increase in trading volume, while the Asian session pullback is reduced, indicating that the selling pressure is limited.
3. 1-hour level - short-term trading anchor point
Time-sharing support:
Strong defensive position 3356 (starting point of Asian morning session + Bollinger middle rail)
Bull lifeline 3348 (previous high conversion support + V-shaped retracement 61.8% position)
Intraday channel: Currently running along the rising channel (lower rail 3355/upper rail 3395)
Today's three-dimensional trading strategy
▶ Main long plan
Best entry area: 3362-3355 (4-hour EMA10 and channel lower rail overlap area)
Position allocation: 50% main position, stop loss 3345 (stop loss moves up after breaking through the previous high)
Target 1: 3385 (equal amplitude measurement after breaking through the Asian session high)
Target 2: 3400 (reduce position by 50% in the daily pressure zone)
Target 3: 3415 (clear position at the wave theory target position)
▶ Auxiliary short opportunities
Counter-trend conditions: first touch 3408 and appear:
1-hour chart pregnancy line/evening star
MACD top divergence + shrinking trading volume
Operation: light position short (position ≤ 20%), stop loss 3418, target 3380
▶ Breakthrough chasing order strategy
Break above 3402: fall back to 3392 to chase long, stop loss 3385, target 3425
Break below 3348: rise and rebound to 3352 to short, stop loss 3360, target 3330
Trade active
Latest analysis of spot gold:
Today, bulls pulled up in the early Asian session with the help of Israeli news, and the theoretical expected target was achieved. Next, pay attention to the high and fall. However, under the influence of geopolitical news, the upward space of bulls may be extended; the resistance area of 3435 was broken, and the upper side continued to look at 3468-3493. There was basically no fall in the early trading, and it was pulled up. The current 3400-05 area constitutes the next strong and weak watershed, and the 3380 area constitutes the long and short watershed; in the short term, keep bullish and follow the trend, and participate in the short position at the key position above. Once the risk aversion fades, the decline is also a straight line!
Technically, after the strong rise in the morning at the 4-hour level, try not to chase highs. This week's market rise is not unilateral, but a fluctuating rise. The characteristic of this rise is that it will be killed at any time in the middle. Although it is known that it will rise later, it continues to sweep back and forth through a sharp drop in the middle, which brings certain difficulties to the operation. This week, many investors have been swept and lost. The points are still there, but the money in the positions is gone. The short-term support points of 3420, 3402, and 3380 will become the key support for testing long positions. If the European session is strong, 3420 cannot be lost, and if it falls back and loses, it will move closer to the top and bottom conversion position of 3402. In the future, we must pay attention to the weakening of the upward momentum.If the European session continues to break the high of 3440, the US session can be seen around 3468-3493. If the upward momentum in the European session weakens, we need to watch out for a short-selling counterattack and a sharp decline.
Trade closed: target reached
Analysis of gold market: Affected by the geopolitical situation in the Middle East, gold and crude oil rose sharply in the Asian morning. Currently, they are purely driven by news.
① The daily indicator macd golden cross is initially established, the dynamic indicator sto runs upward, and the three tracks of the Bollinger Bands and the moving average are all in a bullish arrangement, so the daily line will start an upward trend.
②After yesterday's sideways consolidation in the 4-hour chart, a big positive candle continued to rise and broke the high point in the Asian morning, so the current support is around 3399-3393, followed by the low point around 3376-3380. The 4-hour indicator macd golden cross oscillates with large volume, and the dynamic indicator sto runs overbought, indicating that the 4-hour oscillation is strong. The current 4-hour support moving average MA5 is near 3409, followed by the upper track near 3390.
③ The hourly line is currently macd golden cross oscillating at a high level, and the dynamic indicator sto is overbought, indicating that the current price is still oscillating at a high level.
In summary: Gold prices are currently bullish, short-term volatility is strong, pay attention to the previous high point 3445 line pressure, break the price to 3470-3500, otherwise the price may fluctuate and fall. Focus on key points, and it is expected that there will be an adjustment when they are touched for the first time.
Trading ideas: Currently pay attention to the pressure of 3445-3470-3490 above, and there will be a 5-minute stagflation reversal kk to enter the market and short
Pay attention to the following: 3415-3403 3390 3378 support appears 5-minute stop-loss reversal k to enter the market and go long。
Related publications
Disclaimer
The information and publications are not meant to be, and do not constitute, financial, investment, trading, or other types of advice or recommendations supplied or endorsed by TradingView. Read more in the Terms of Use.
Related publications
Disclaimer
The information and publications are not meant to be, and do not constitute, financial, investment, trading, or other types of advice or recommendations supplied or endorsed by TradingView. Read more in the Terms of Use.