This week, global financial markets will look forward to US inflation data for July (CPI, PPI), retail sales data and speeches from several Federal Reserve officials.
These important pieces of information will directly impact expectations for a September rate cut and influence the performance of the US Dollar, gold, crude oil and US stocks.
On the political front, US President Donald Trump's public pressure on the Federal Reserve and recent appointments have raised market concerns about the independence of monetary policy, while escalating tariffs continue to raise the risk of global trade conflicts.
Federal Reserve: Policy Disruption and Dovish Signals Coexist
This week, the Fed kept its target range for the federal funds rate unchanged at 4.25% to 4.50%, but the vote was split, with two officials—Vice Chair Michelle Bowman and Governor Christopher Waller—in favor of an immediate quarter-point rate cut.
 DXY : Technical Pressure and Political Risk
The US Dollar Index (DXY) has fallen to around 98 this week, failing to hold above 100. Technically, a break of the July low of 96.37 could lead to a drop to 95.13 and 94.62. Despite the 10-year Treasury yield rising to 4.285%, the Dollar remains under pressure, reflecting market concerns about political risks in the United States.
If CPI is higher than expected this week, the market may feel like it is moving too fast, which could cause volatility.
Traders generally believe that Trump's tariff policies, public criticism of the Federal Reserve and uncertainty about the fiscal deficit are all weakening the medium- to long-term support for the US Dollar.
Markets will be watching closely to see if the impact of tariffs starts to show in inflation data, and if consumer spending data confirms the economic recovery. A positive reading would reinforce expectations for a rate cut, a positive signal for stocks and gold. An unexpected rise in inflation could slow the pace of Fed easing, weighing on risk assets and supporting the US DollarDXY .
![GOLD MARKET ANALYSIS AND COMMENTARY - [Aug 11 - Aug 15]](https://tradingview.sweetlogin.com/proxy-s3/m/me5F9vGn_mid.png)
Technical Outlook Analysis XAUUSD
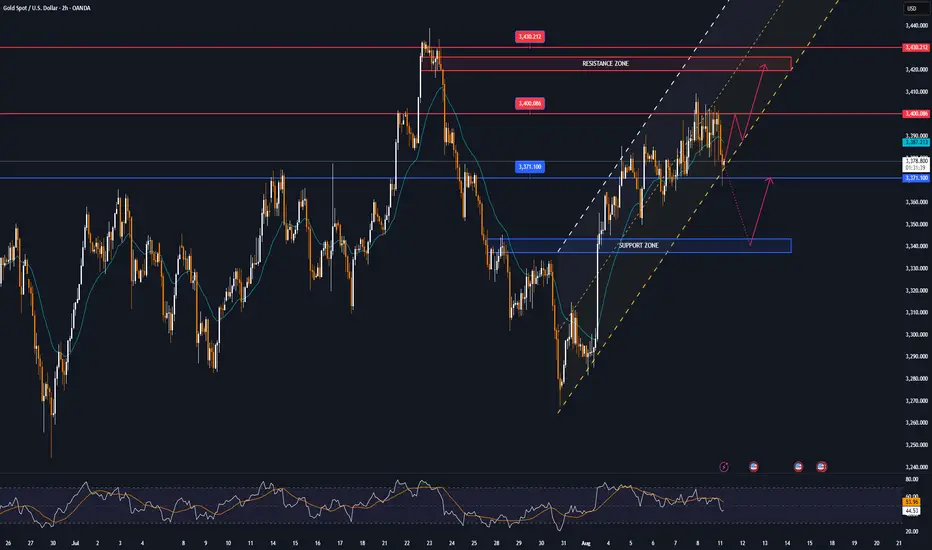
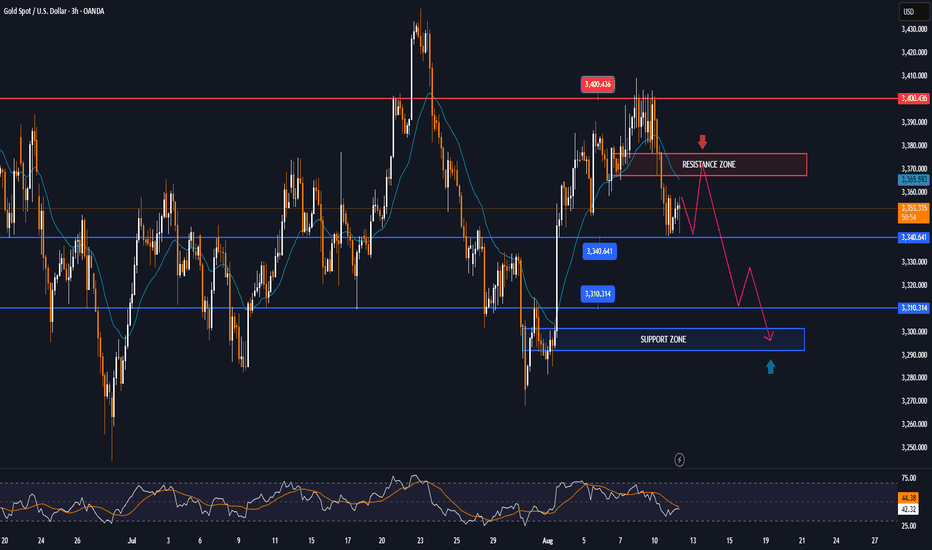
Gold has been on a long bullish recovery since breaking out and holding above the $3,300 base point, and currently structurally it has not changed much with the uptrend still dominating the daily chart.
Specifically, in the short term, gold is supported by the EMA21 with the target at the $3,400 base point noted by readers in the weekly publication last week has been achieved.
Looking ahead, the horizontal support at the 0.236% Fibonacci retracement will be the nearest support to reinforce the expectation of a continued breakout of gold prices breaking through the $3,400 point towards the $3,430 – $3,450 level.
In terms of momentum, the Relative Strength Index (RSI) has moved above 50 but is still quite far from the overbought zone (80-100), indicating that there is still a lot of room for upside ahead.
Meanwhile, even if gold is sold below the EMA21, the declines are not considered a specific technical trend in the short term, as long as the support levels of 3,310 – 3,300 USD and Fibonacci 0.382% are not broken below.
Finally, in terms of position as well as technical conditions, the gold price on the daily chart currently has a technical outlook leaning more towards the upside and the notable points will be listed as follows.
Support: 3,371 – 3,350 – 3,340 USD
Resistance: 3,400 – 3,430 – 3,350 USD
SELL XAUUSD PRICE 3424 - 3422⚡️
↠↠ Stop Loss 3428
→Take Profit 1 3416
↨
→Take Profit 2 3410
BUY XAUUSD PRICE 3338 - 3340⚡️
↠↠ Stop Loss 3334
→Take Profit 1 3346
↨
→Take Profit 2 3352
These important pieces of information will directly impact expectations for a September rate cut and influence the performance of the US Dollar, gold, crude oil and US stocks.
On the political front, US President Donald Trump's public pressure on the Federal Reserve and recent appointments have raised market concerns about the independence of monetary policy, while escalating tariffs continue to raise the risk of global trade conflicts.
Federal Reserve: Policy Disruption and Dovish Signals Coexist
This week, the Fed kept its target range for the federal funds rate unchanged at 4.25% to 4.50%, but the vote was split, with two officials—Vice Chair Michelle Bowman and Governor Christopher Waller—in favor of an immediate quarter-point rate cut.
The US Dollar Index (DXY) has fallen to around 98 this week, failing to hold above 100. Technically, a break of the July low of 96.37 could lead to a drop to 95.13 and 94.62. Despite the 10-year Treasury yield rising to 4.285%, the Dollar remains under pressure, reflecting market concerns about political risks in the United States.
If CPI is higher than expected this week, the market may feel like it is moving too fast, which could cause volatility.
Traders generally believe that Trump's tariff policies, public criticism of the Federal Reserve and uncertainty about the fiscal deficit are all weakening the medium- to long-term support for the US Dollar.
Markets will be watching closely to see if the impact of tariffs starts to show in inflation data, and if consumer spending data confirms the economic recovery. A positive reading would reinforce expectations for a rate cut, a positive signal for stocks and gold. An unexpected rise in inflation could slow the pace of Fed easing, weighing on risk assets and supporting the US Dollar
Technical Outlook Analysis
Gold has been on a long bullish recovery since breaking out and holding above the $3,300 base point, and currently structurally it has not changed much with the uptrend still dominating the daily chart.
Specifically, in the short term, gold is supported by the EMA21 with the target at the $3,400 base point noted by readers in the weekly publication last week has been achieved.
Looking ahead, the horizontal support at the 0.236% Fibonacci retracement will be the nearest support to reinforce the expectation of a continued breakout of gold prices breaking through the $3,400 point towards the $3,430 – $3,450 level.
In terms of momentum, the Relative Strength Index (RSI) has moved above 50 but is still quite far from the overbought zone (80-100), indicating that there is still a lot of room for upside ahead.
Meanwhile, even if gold is sold below the EMA21, the declines are not considered a specific technical trend in the short term, as long as the support levels of 3,310 – 3,300 USD and Fibonacci 0.382% are not broken below.
Finally, in terms of position as well as technical conditions, the gold price on the daily chart currently has a technical outlook leaning more towards the upside and the notable points will be listed as follows.
Support: 3,371 – 3,350 – 3,340 USD
Resistance: 3,400 – 3,430 – 3,350 USD
SELL XAUUSD PRICE 3424 - 3422⚡️
↠↠ Stop Loss 3428
→Take Profit 1 3416
↨
→Take Profit 2 3410
BUY XAUUSD PRICE 3338 - 3340⚡️
↠↠ Stop Loss 3334
→Take Profit 1 3346
↨
→Take Profit 2 3352
Note
🔰| Forex trading
🧩Get an average of 1200 pips per month
🧩Consulting on Risk Management
🧩Account management
🧩Forex signals have a high win rate
🚨🚨🚨FREE SIGNALS: t.me/+8q3AxDD9CsRjYzI1
🧩Get an average of 1200 pips per month
🧩Consulting on Risk Management
🧩Account management
🧩Forex signals have a high win rate
🚨🚨🚨FREE SIGNALS: t.me/+8q3AxDD9CsRjYzI1
Related publications
Disclaimer
The information and publications are not meant to be, and do not constitute, financial, investment, trading, or other types of advice or recommendations supplied or endorsed by TradingView. Read more in the Terms of Use.