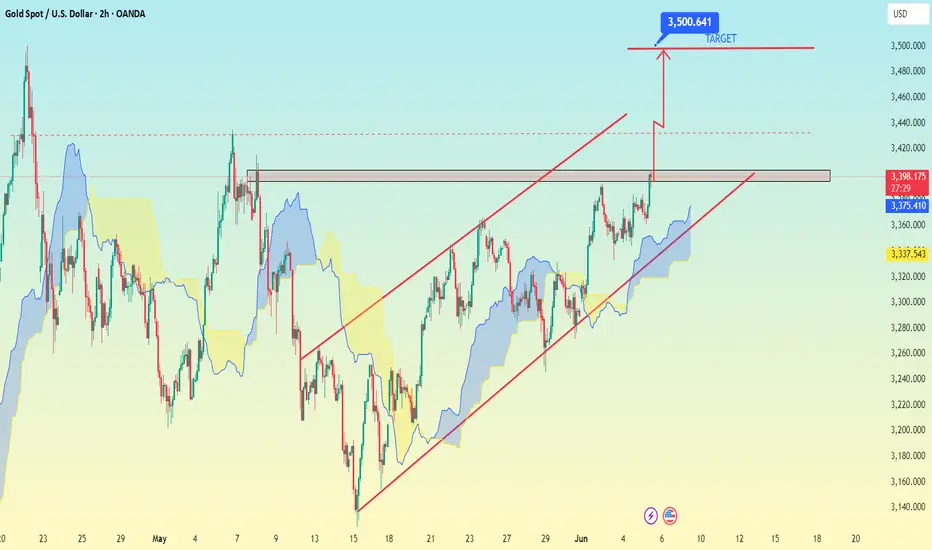
From your XAU/USD (Gold vs USD) 2-hour chart, im showing a bullish channel breakout with a clearly marked target level.
📊 Observations:
The chart displays an ascending channel with price breaking above a key resistance zone (~3412).
The projected target is explicitly marked at:
🎯 3,500.641
This is likely derived from a measured move using the height of the previous consolidation range added to the breakout point.
---
🔍 Summary:
Breakout Zone: ~3,412
Target Zone: 3,500.641
Support Zones:
Near-term: 3,370 – 3,390
Channel bottom: ~3,337
Key invalidation: Below 3,320
Would you like help with setting a stop-loss or trailing exit plan to lock in profits as price moves?
Trade active
trade activet.me/forexofdollarsmagnet
Forex, gold and crypto signal's with detailed analysis & get consistent results..
t.me/Jhonscalpertrade11
Gold signal's with proper TP & SL for high profits opportunities..
Forex, gold and crypto signal's with detailed analysis & get consistent results..
t.me/Jhonscalpertrade11
Gold signal's with proper TP & SL for high profits opportunities..
Related publications
Disclaimer
The information and publications are not meant to be, and do not constitute, financial, investment, trading, or other types of advice or recommendations supplied or endorsed by TradingView. Read more in the Terms of Use.
t.me/forexofdollarsmagnet
Forex, gold and crypto signal's with detailed analysis & get consistent results..
t.me/Jhonscalpertrade11
Gold signal's with proper TP & SL for high profits opportunities..
Forex, gold and crypto signal's with detailed analysis & get consistent results..
t.me/Jhonscalpertrade11
Gold signal's with proper TP & SL for high profits opportunities..
Related publications
Disclaimer
The information and publications are not meant to be, and do not constitute, financial, investment, trading, or other types of advice or recommendations supplied or endorsed by TradingView. Read more in the Terms of Use.