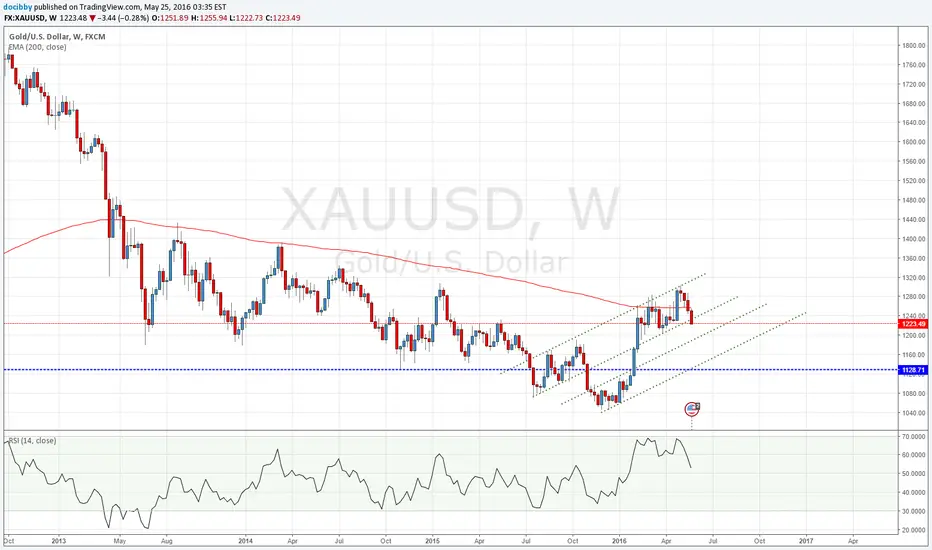
If we look at a WEEKLY big picture chart we can see how important this 200EMA has been. Apart from important recent horizontal lows we can see how a pattern of diagonal support/resistance channels has been established. If a retrace back to the initial breakout zone happens..... then even 1128.71 USD would be a possibility.
Disclaimer
The information and publications are not meant to be, and do not constitute, financial, investment, trading, or other types of advice or recommendations supplied or endorsed by TradingView. Read more in the Terms of Use.
Disclaimer
The information and publications are not meant to be, and do not constitute, financial, investment, trading, or other types of advice or recommendations supplied or endorsed by TradingView. Read more in the Terms of Use.