The previous rally continued in the early Asian session on Thursday, reaching a high of around 3345.
However, it then began to fall rapidly. So far, gold has fallen below the 3300 mark again, with the lowest point reaching around 3280.
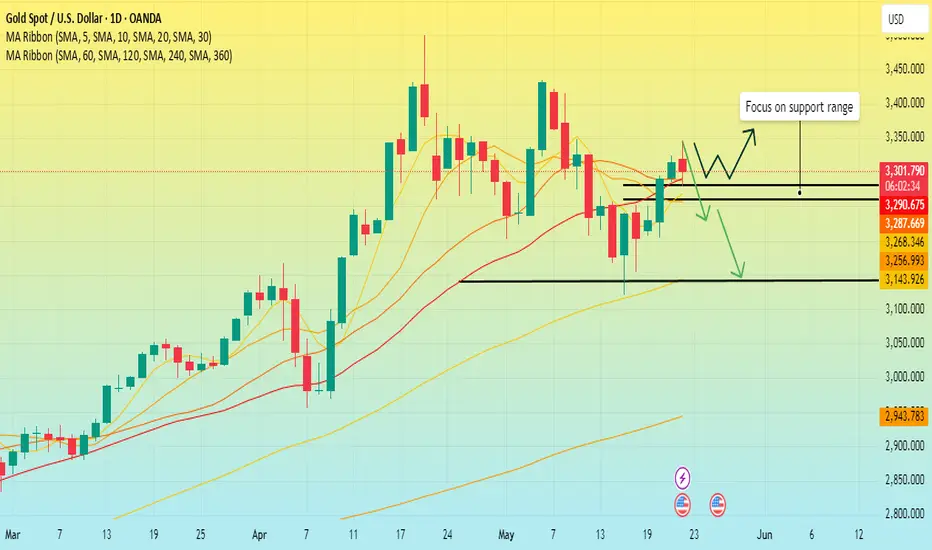
From the daily chart:
Gold is currently at 3280, which is the moving average support position. If it falls below 3280, the market will test 3250-3260 below. This position is not only the current daily moving average support position, but also an important barrier position in the past. This is an important suppression position for the upward trend of gold this time.
Similarly, if it wants to fall, 3250-60 is also an important support position.
Secondly, let's look at the 4-hour chart:

If it really falls below the bottom of the range at 3280, then as I said above, it will test 3250-3260. However, if it fails to break the support near 3280, it is very likely to maintain consolidation in the 4-hour range.
And from the range point of view, the fluctuation range is very large. It is basically maintained in the range of 3320-3280, which is about 40 US dollars. I suggest that we should still pay attention to whether the support here at 3280 can stabilize. If it can stabilize at this position, and there is a bottom signal at 3280, then you can go long near 3280. Sell high and buy low according to the range of 3280-3320.
On the contrary, if it falls below the support of 3280, don’t go long. It is very likely to directly test the support position of 3250-60 later.
However, it then began to fall rapidly. So far, gold has fallen below the 3300 mark again, with the lowest point reaching around 3280.
From the daily chart:
Gold is currently at 3280, which is the moving average support position. If it falls below 3280, the market will test 3250-3260 below. This position is not only the current daily moving average support position, but also an important barrier position in the past. This is an important suppression position for the upward trend of gold this time.
Similarly, if it wants to fall, 3250-60 is also an important support position.
Secondly, let's look at the 4-hour chart:
If it really falls below the bottom of the range at 3280, then as I said above, it will test 3250-3260. However, if it fails to break the support near 3280, it is very likely to maintain consolidation in the 4-hour range.
And from the range point of view, the fluctuation range is very large. It is basically maintained in the range of 3320-3280, which is about 40 US dollars. I suggest that we should still pay attention to whether the support here at 3280 can stabilize. If it can stabilize at this position, and there is a bottom signal at 3280, then you can go long near 3280. Sell high and buy low according to the range of 3280-3320.
On the contrary, if it falls below the support of 3280, don’t go long. It is very likely to directly test the support position of 3250-60 later.
Related publications
Disclaimer
The information and publications are not meant to be, and do not constitute, financial, investment, trading, or other types of advice or recommendations supplied or endorsed by TradingView. Read more in the Terms of Use.
Related publications
Disclaimer
The information and publications are not meant to be, and do not constitute, financial, investment, trading, or other types of advice or recommendations supplied or endorsed by TradingView. Read more in the Terms of Use.