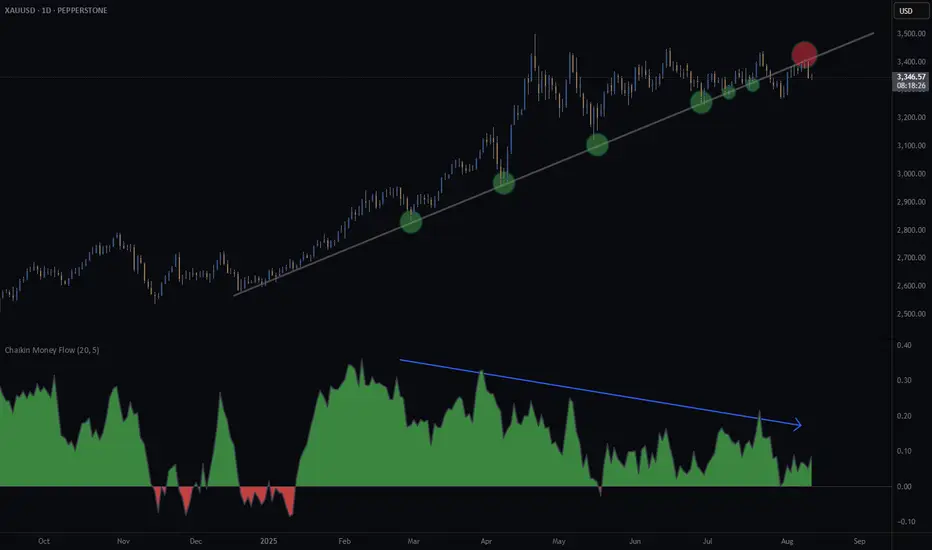
Since December 2024, gold has held above a key diagonal support line (see chart).
On 25 July 2025, price broke below a medium-term diagonal support — and recent action looks more like a break-and-retest than a full recovery.
The Chaikin Money Flow is also showing negative divergence, suggesting buying pressure is weakening even as price tried to push higher. That’s often a warning sign for potential trend reversals.
Could this be the start of a deeper move down, or just a pause before new highs?
What’s your take — has gold topped?
Disclaimer
The information and publications are not meant to be, and do not constitute, financial, investment, trading, or other types of advice or recommendations supplied or endorsed by TradingView. Read more in the Terms of Use.
Disclaimer
The information and publications are not meant to be, and do not constitute, financial, investment, trading, or other types of advice or recommendations supplied or endorsed by TradingView. Read more in the Terms of Use.