SMC Trading point update
Technical analysis for XAU/USD (Gold vs. US Dollar) on the 4-hour timeframe suggests a bullish reversal setup from a key support zone. Here's a breakdown of the idea:
Key Observations:
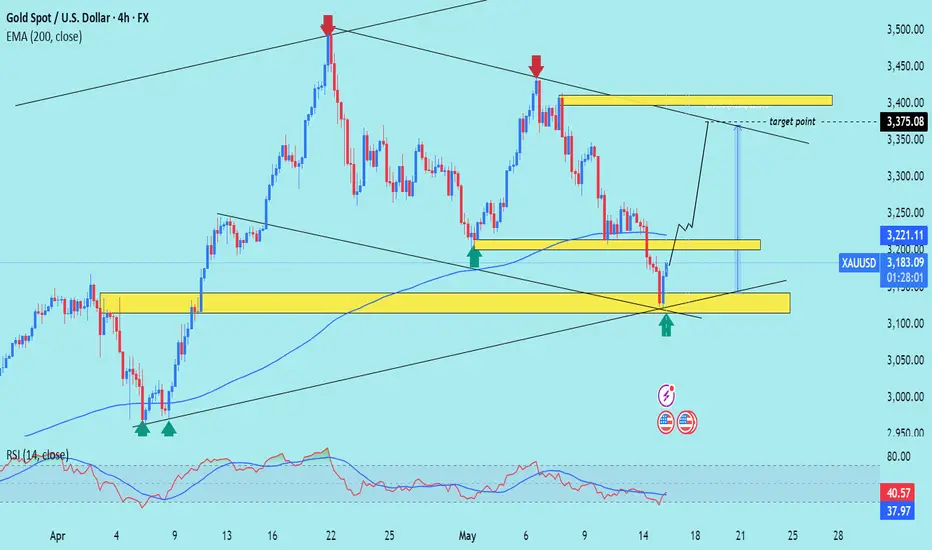
1. Support Zone (Yellow Box at ~3,100–3,140):
The price recently touched a significant support area marked by multiple previous bounces (green arrows).
The latest green arrow shows a bullish reaction from this zone, indicating potential for an upward move.
2. Resistance Zone (~3,220–3,250):
This intermediate zone is expected to be the first area of interest for bulls.
The analysis suggests a brief pullback or consolidation before continuation.
3. Target Point (~3,375):
The chart outlines a projected move to around 3,375, aligning with a previous supply zone and the upper channel line.
This is likely the main target for a swing trade.
4. EMA 200 (Blue Line - ~3,221):
Price is hovering around the 200 EMA, acting as a dynamic resistance.
A breakout above this would add bullish confirmation.
5. RSI Indicator (~41):
RSI is recovering from an oversold region (~38), indicating potential momentum building for a reversal.
Mr SMC Trading point
---
Conclusion:
This is a bullish reversal setup with:
Entry zone: Around 3,120–3,140
Short-term resistance: ~3,220–3,250
Final target: ~3,375
Invalidation: A clear break and close below the yellow support box (~3,100)
Pales support boost 🚀 analysis follow)
Technical analysis for XAU/USD (Gold vs. US Dollar) on the 4-hour timeframe suggests a bullish reversal setup from a key support zone. Here's a breakdown of the idea:
Key Observations:
1. Support Zone (Yellow Box at ~3,100–3,140):
The price recently touched a significant support area marked by multiple previous bounces (green arrows).
The latest green arrow shows a bullish reaction from this zone, indicating potential for an upward move.
2. Resistance Zone (~3,220–3,250):
This intermediate zone is expected to be the first area of interest for bulls.
The analysis suggests a brief pullback or consolidation before continuation.
3. Target Point (~3,375):
The chart outlines a projected move to around 3,375, aligning with a previous supply zone and the upper channel line.
This is likely the main target for a swing trade.
4. EMA 200 (Blue Line - ~3,221):
Price is hovering around the 200 EMA, acting as a dynamic resistance.
A breakout above this would add bullish confirmation.
5. RSI Indicator (~41):
RSI is recovering from an oversold region (~38), indicating potential momentum building for a reversal.
Mr SMC Trading point
---
Conclusion:
This is a bullish reversal setup with:
Entry zone: Around 3,120–3,140
Short-term resistance: ~3,220–3,250
Final target: ~3,375
Invalidation: A clear break and close below the yellow support box (~3,100)
Pales support boost 🚀 analysis follow)
Trade active
(Services:✔️ JOIN Telegram channel
#Gold trading ★Analysis★ 📊
Gold trading signals 🚀 99%
t.me/SmcTradingPoin
Join my recommended broker , link 👇
World best broker exness ✅D
one.exnesstrack.org/a/l1t1rf3p6v
#Gold trading ★Analysis★ 📊
Gold trading signals 🚀 99%
t.me/SmcTradingPoin
Join my recommended broker , link 👇
World best broker exness ✅D
one.exnesstrack.org/a/l1t1rf3p6v
Related publications
Disclaimer
The information and publications are not meant to be, and do not constitute, financial, investment, trading, or other types of advice or recommendations supplied or endorsed by TradingView. Read more in the Terms of Use.