Gold technical analysis:
Daily chart resistance 3440, support 3310
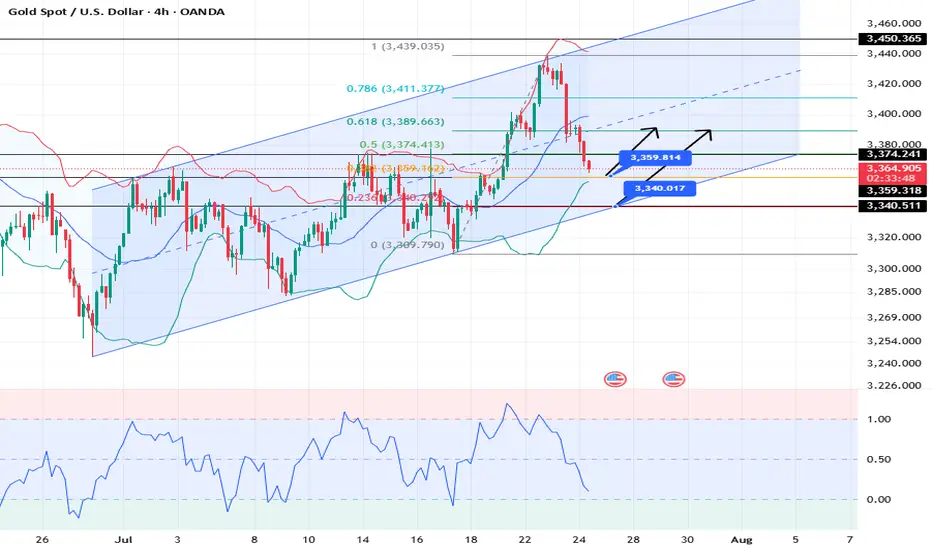
4-hour chart resistance 3390, support 3340
1-hour chart resistance 3375, support 3360.
Yesterday, according to news, the United States and the European Union were close to reaching a trade agreement, which led to the recent risk aversion sentiment to subside, and the bulls took profits. The gold price has fallen by nearly $80 from its peak.
From the current power comparison, the bears are temporarily dominant. Since yesterday, the candlestick chart of the 4-hour chart has completed 6 candles today (2 of which are sideways and 4 are falling sharply). It is expected that it will not rebound until today's NY market trading session.
Gold may reach 3359 or even 3340. At that time, we will observe the stabilization of the candlestick chart. Once the downward momentum is exhausted and it starts to close higher, we can buy. The upper pressure is 3380/3400.
Buy: 3359near
Buy: 3340near
Sell: 3380near
Sell: 3400near
Daily chart resistance 3440, support 3310
4-hour chart resistance 3390, support 3340
1-hour chart resistance 3375, support 3360.
Yesterday, according to news, the United States and the European Union were close to reaching a trade agreement, which led to the recent risk aversion sentiment to subside, and the bulls took profits. The gold price has fallen by nearly $80 from its peak.
From the current power comparison, the bears are temporarily dominant. Since yesterday, the candlestick chart of the 4-hour chart has completed 6 candles today (2 of which are sideways and 4 are falling sharply). It is expected that it will not rebound until today's NY market trading session.
Gold may reach 3359 or even 3340. At that time, we will observe the stabilization of the candlestick chart. Once the downward momentum is exhausted and it starts to close higher, we can buy. The upper pressure is 3380/3400.
Buy: 3359near
Buy: 3340near
Sell: 3380near
Sell: 3400near
💥Telegram Channel Free Updates 👉🏻
💥t.me/Actuary00group
✉️Gold Signal and daily analysis channel
💥t.me/Actuary00group
✉️Gold Signal and daily analysis channel
Disclaimer
The information and publications are not meant to be, and do not constitute, financial, investment, trading, or other types of advice or recommendations supplied or endorsed by TradingView. Read more in the Terms of Use.