Key Zones and Annotations
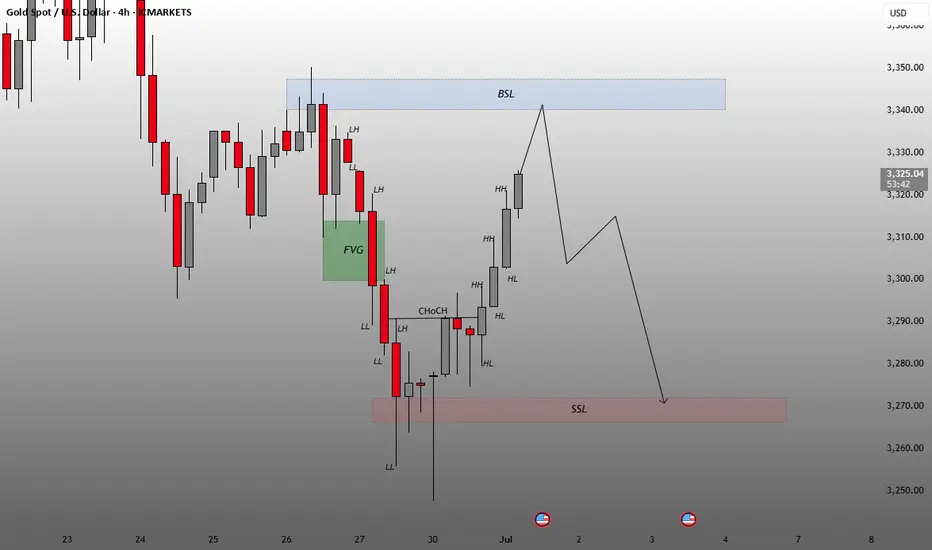
FVG (Fair Value Gap) – Marked in green:
Represents an imbalance in price (gap between candles).
Price often returns here to “fill” or mitigate that inefficiency.
BSL (Buy-Side Liquidity) – Marked in blue near the $3,340 area:
Indicates an area above recent highs where stop-losses (liquidity) might be resting.
This area is often targeted before reversals.
SSL (Sell-Side Liquidity) – Marked in red near the $3,270 area:
Represents liquidity below recent lows.
This is a potential bearish target.
Structure Labels
LL (Lower Low), LH (Lower High), HH (Higher High), HL (Higher Low):
Used to track market structure direction (bearish/bullish trend).
ChoCH (Change of Character):
Indicates a shift in market structure, typically a sign of a trend reversal.
Price Projection
The projected path shows a short-term move upward toward the BSL region (~$3,340), suggesting liquidity grab or premium pricing area.
Then, a bearish reversal is projected targeting the SSL zone (~$3,270), suggesting a potential drop after the BSL is taken.
Conclusion
The chart suggests a short-term bullish move to clear buy-side liquidity followed by a bearish continuation targeting lower liquidity zones. This type of analysis is commonly used in Smart Money Concepts (SMC) or ICT (Inner Circle Trader) methodologies.
Disclaimer
The information and publications are not meant to be, and do not constitute, financial, investment, trading, or other types of advice or recommendations supplied or endorsed by TradingView. Read more in the Terms of Use.
Disclaimer
The information and publications are not meant to be, and do not constitute, financial, investment, trading, or other types of advice or recommendations supplied or endorsed by TradingView. Read more in the Terms of Use.